Linux share
3.7%
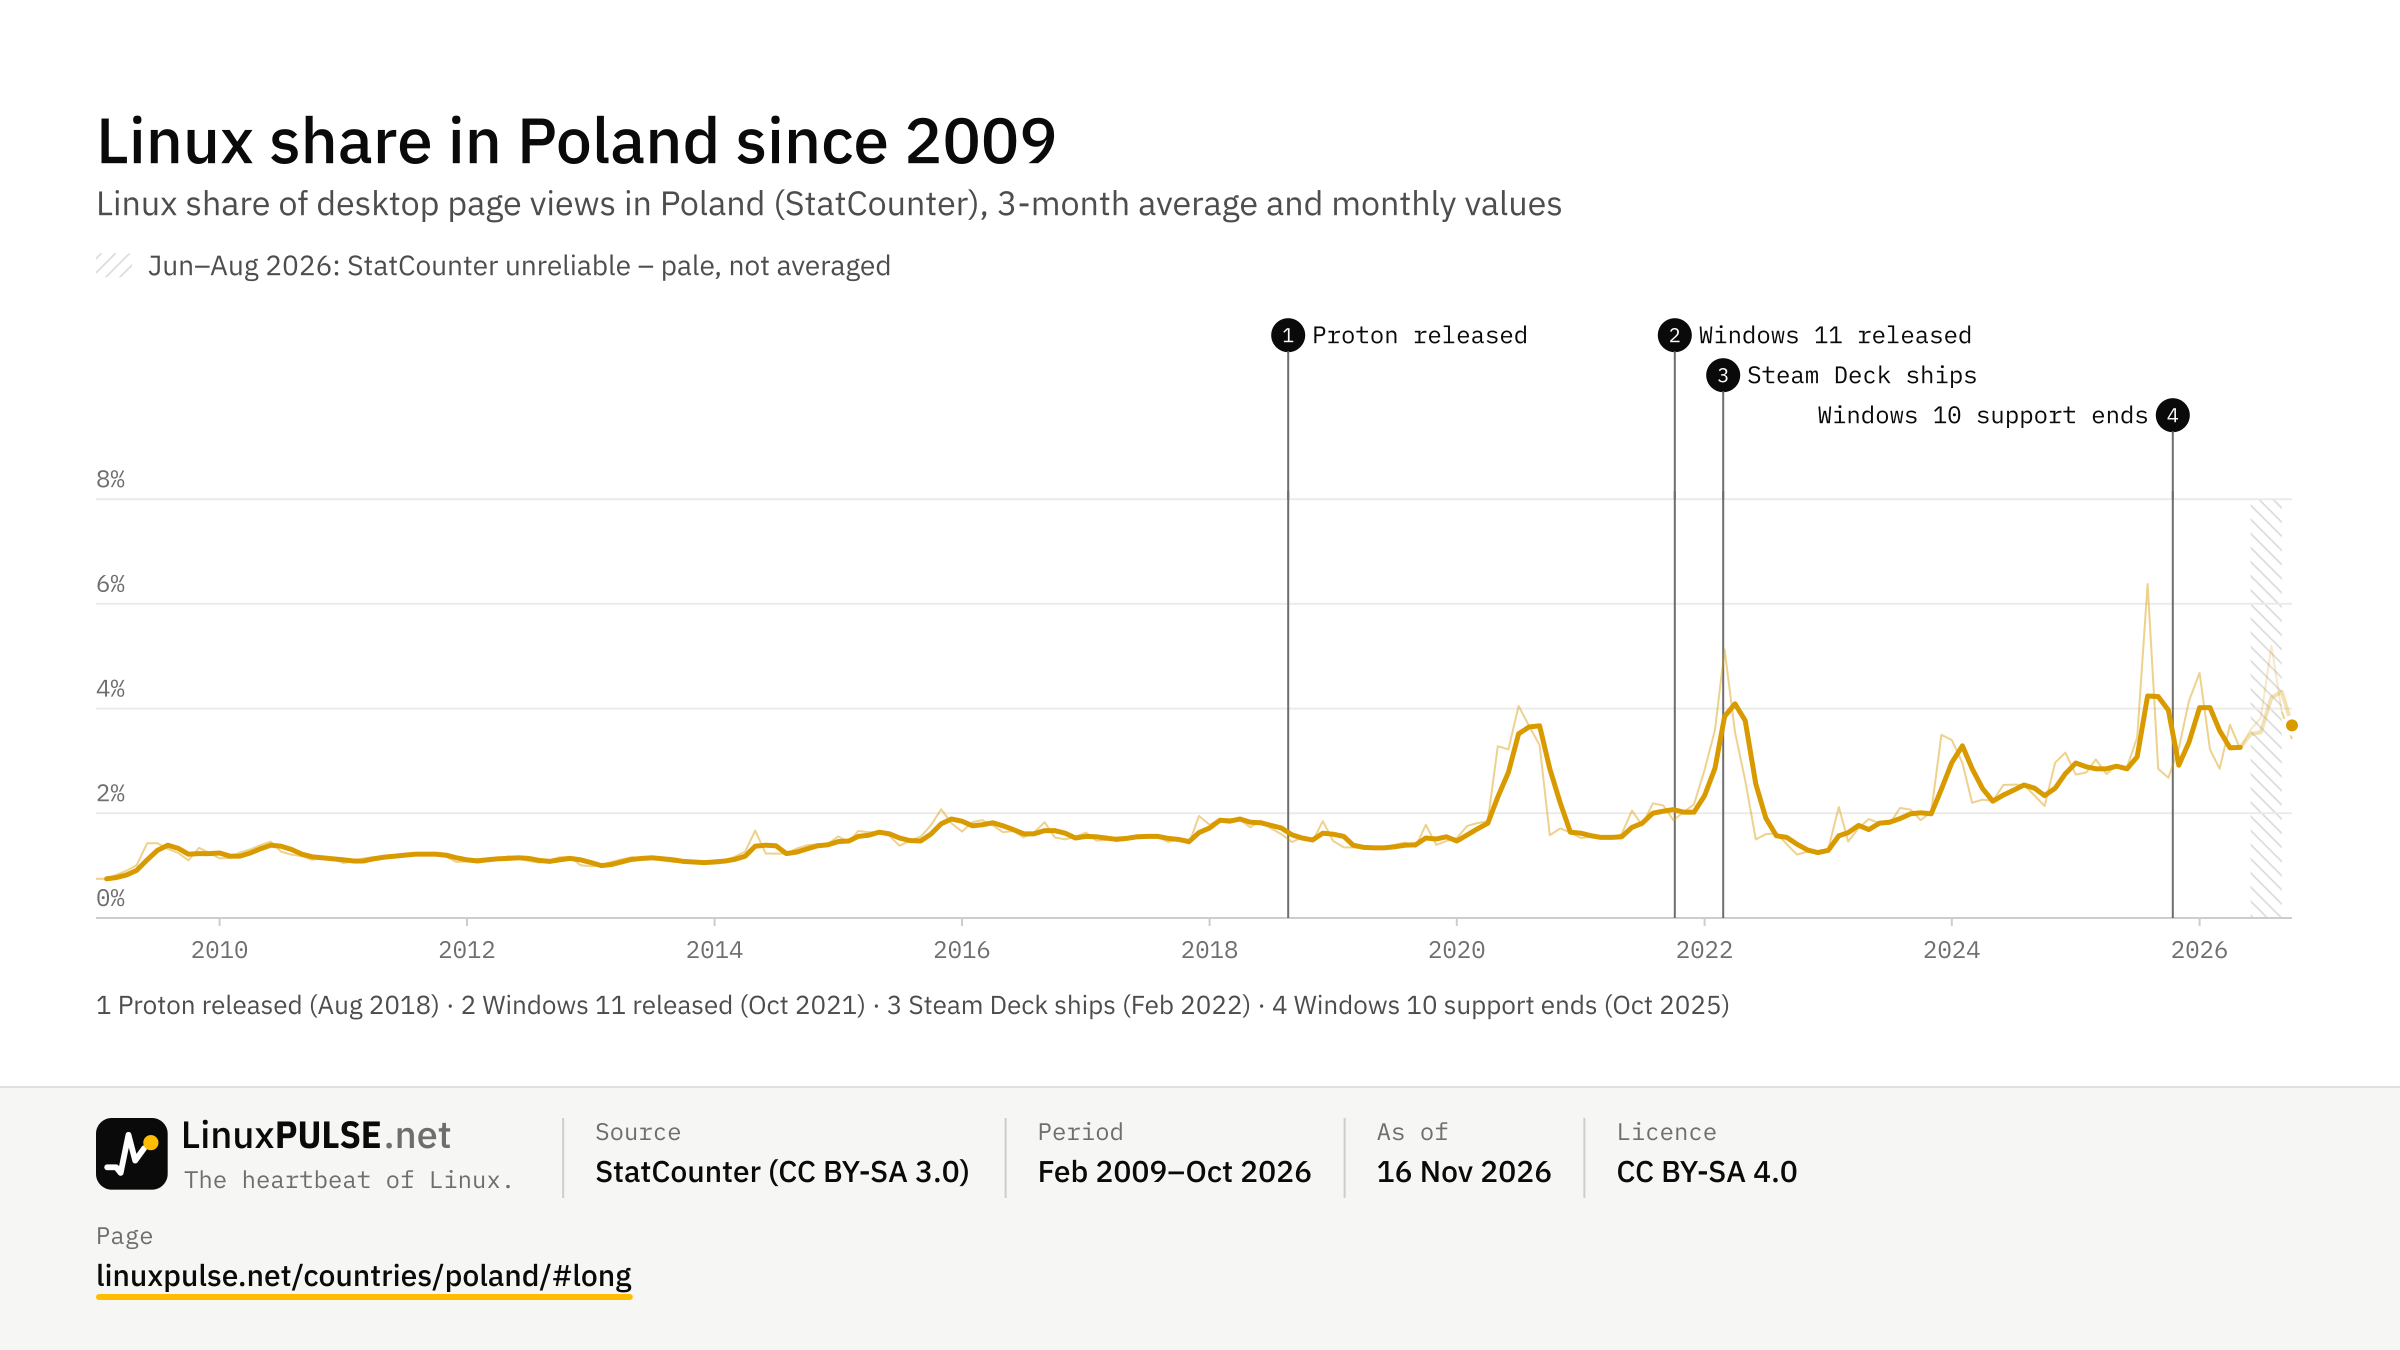
↗ +0.9 pp vs a year agoStatCounter · desktop page views · Sep–Oct 2026Poland: 3.7 % over the last three months, up from a year ago (+0.9 pp).
Linux share
3.7%
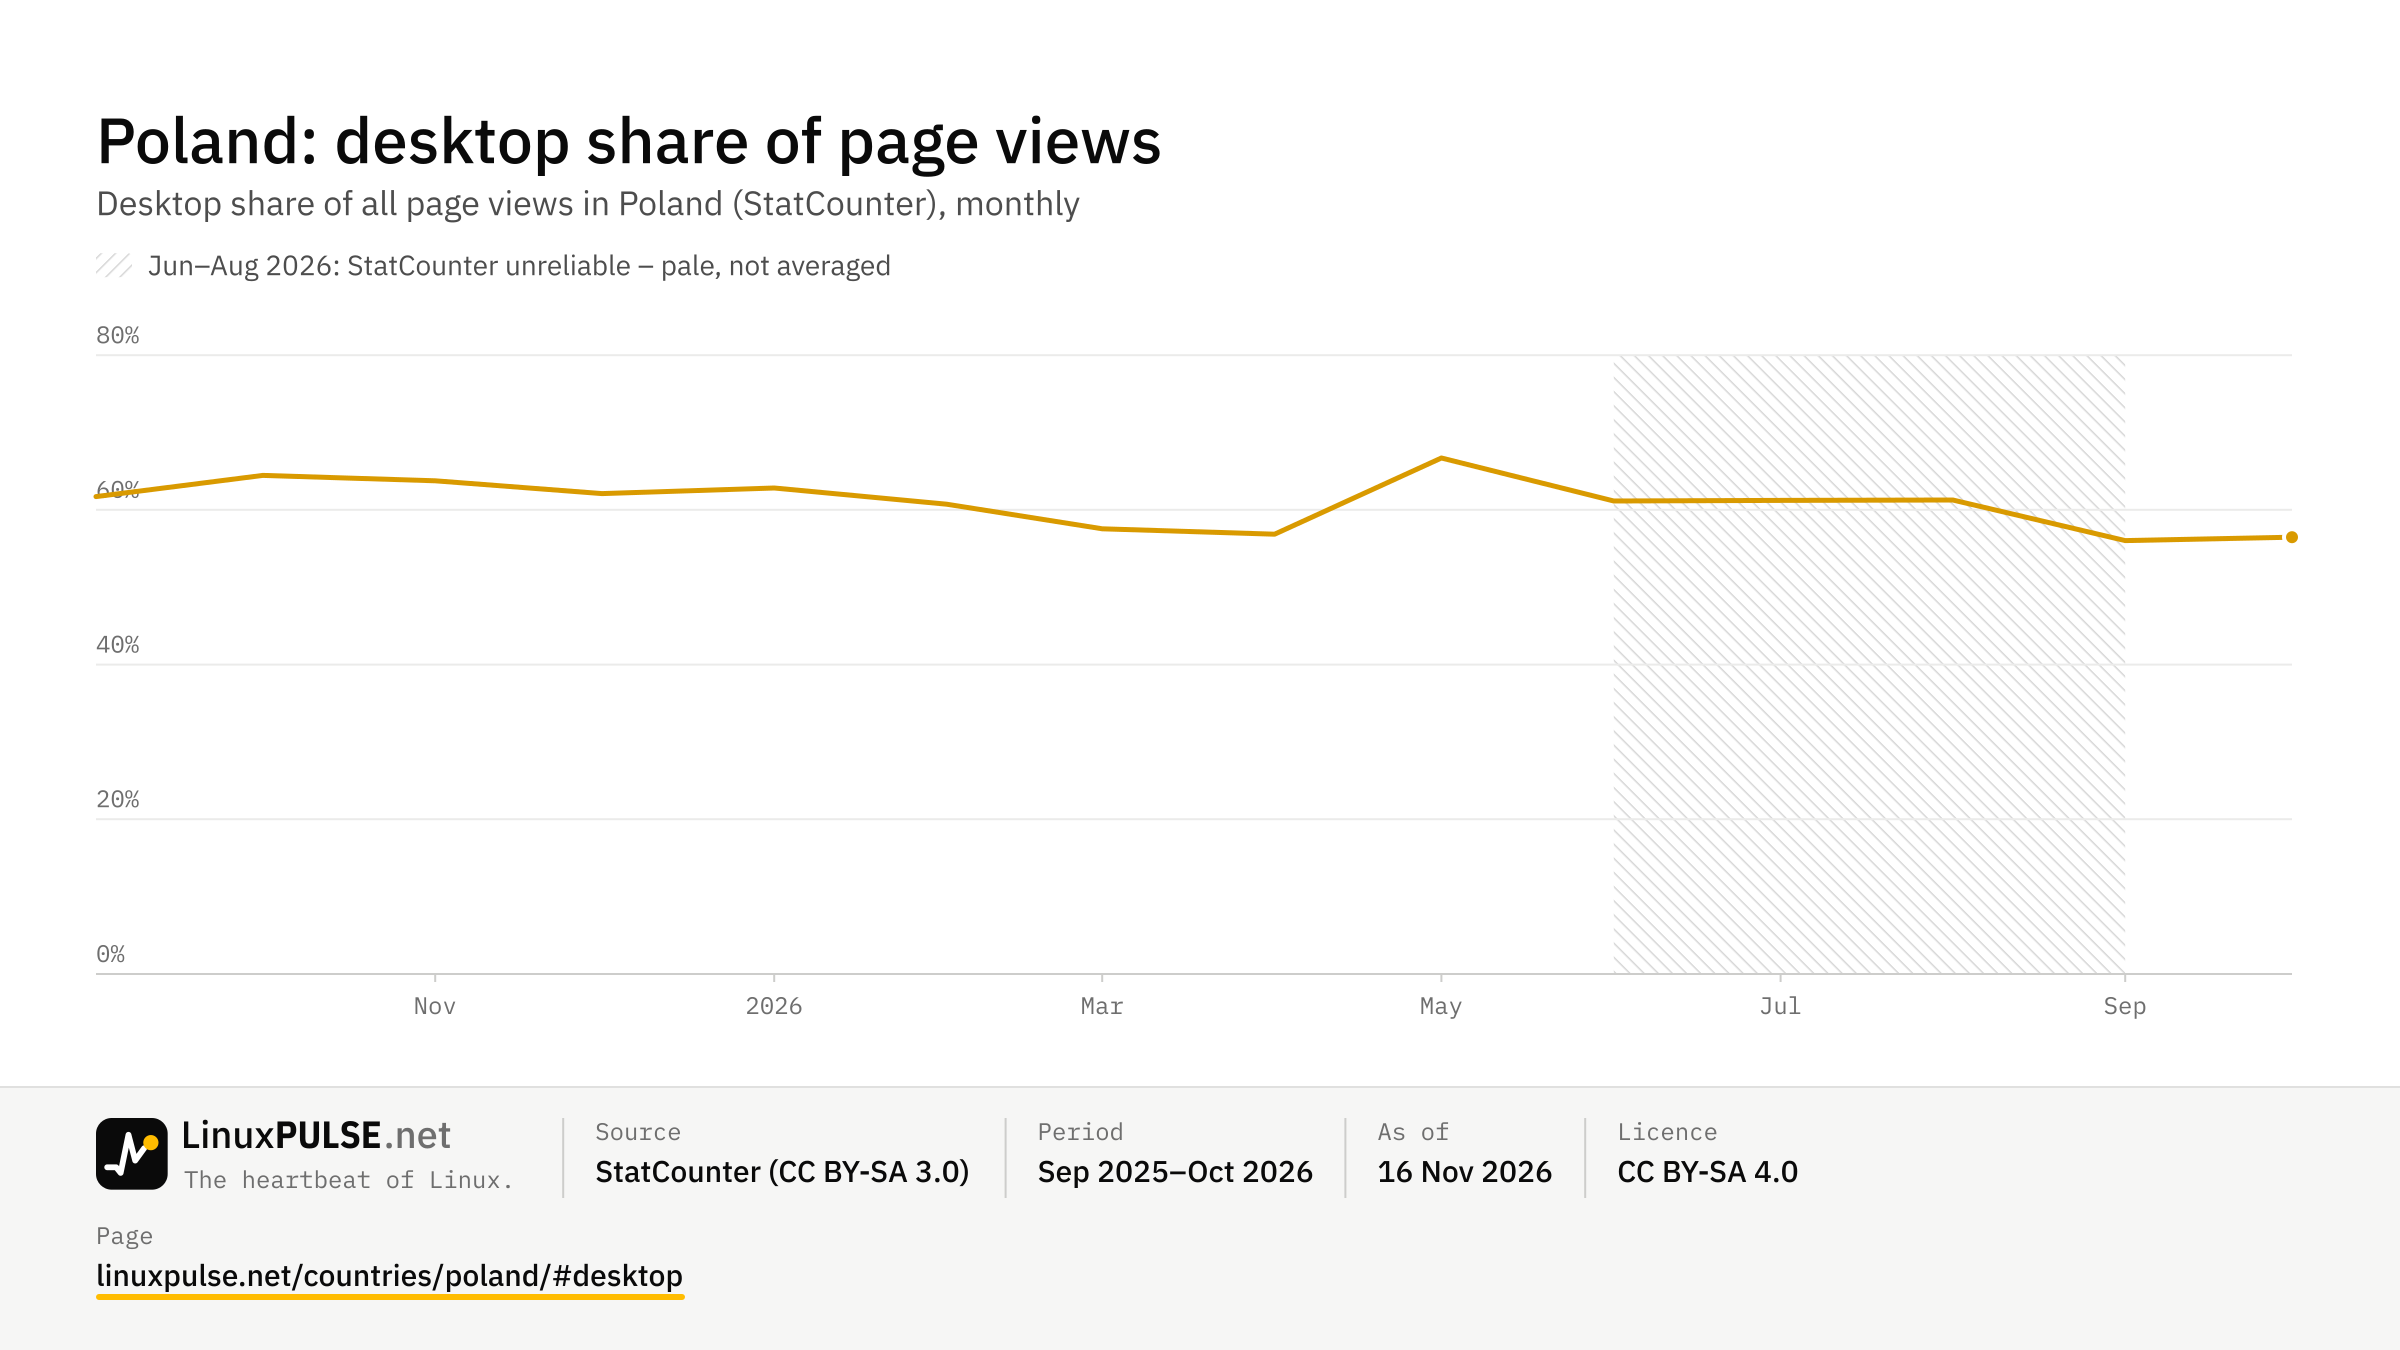
↗ +0.9 pp vs a year agoStatCounter · desktop page views · Sep–Oct 2026Desktop share of page views
61%
StatCounter · desktop vs mobile vs tablet · Sep 2025–May 2026, Sep 2026–Oct 2026PC users (estimate)
19.7M
32.4M internet users (2024) · × desktop shareFlathub downloads per week
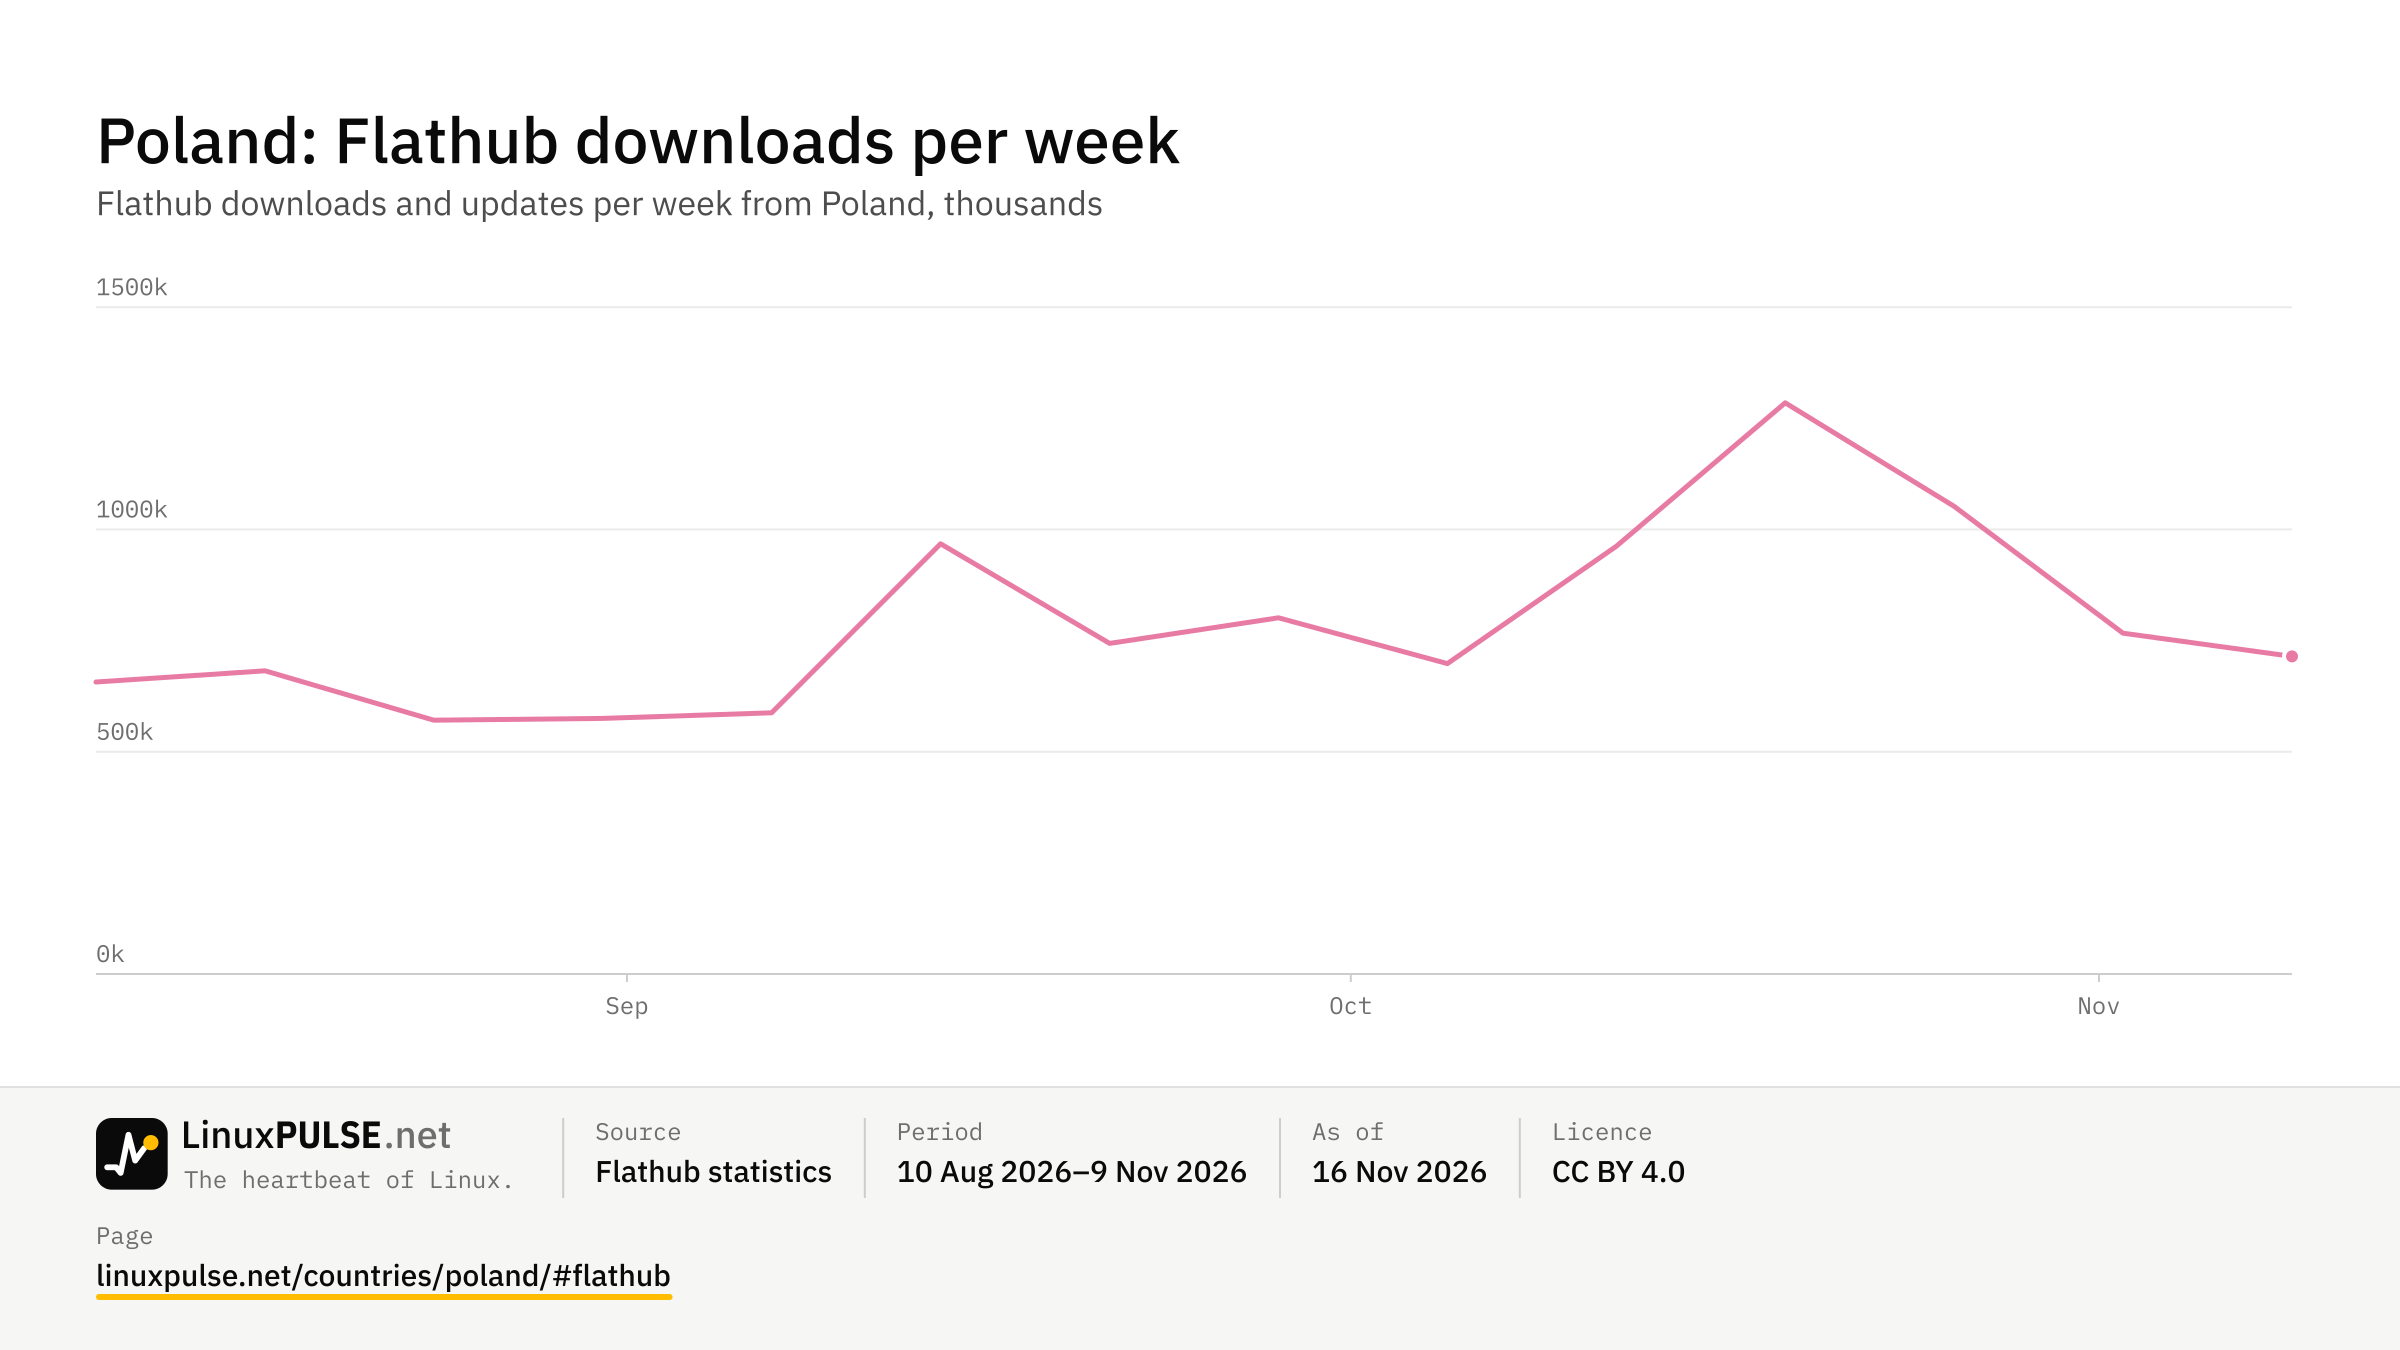
714K
Flathub · week of 9 Nov 2026Arch pkgstats submissions
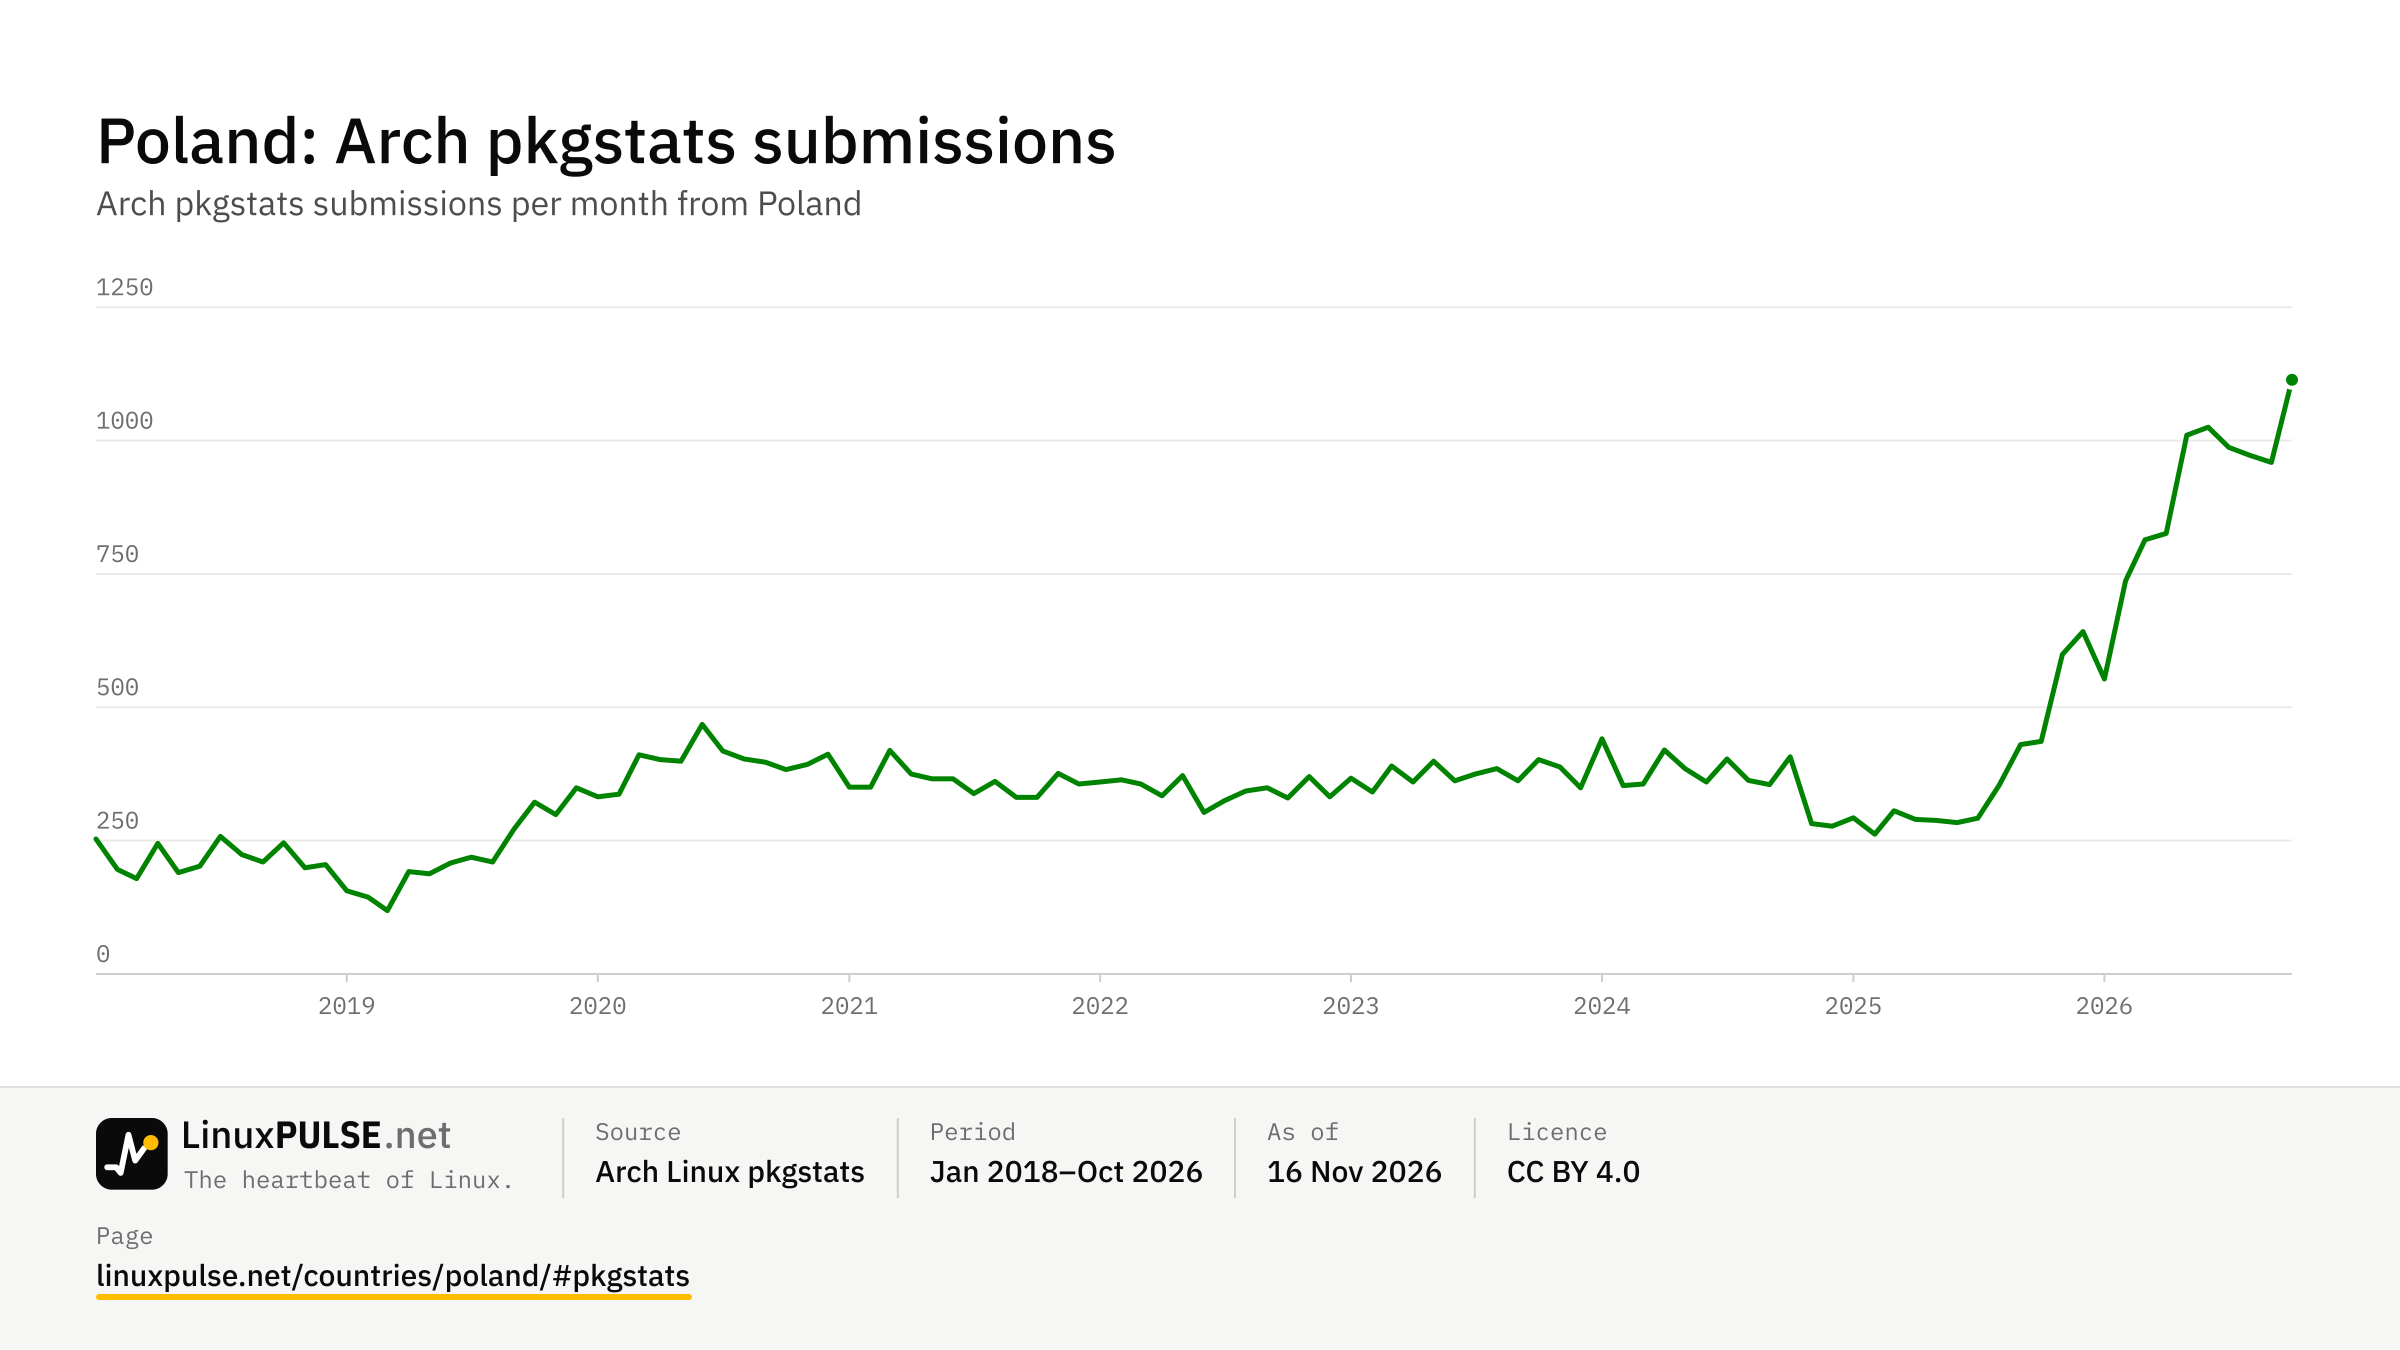
1,114
pkgstats · October 2026| Date | Poland |
|---|---|
| 2026-10-01 | 3.68% |
| 2026-05-01 | 3.26% |
| 2026-04-01 | 3.25% |
| 2026-03-01 | 3.58% |
| 2026-02-01 | 4.02% |
| 2026-01-01 | 4.02% |
| 2025-12-01 | 3.36% |
| 2025-11-01 | 2.92% |
| 2025-10-01 | 3.97% |
| 2025-09-01 | 4.23% |
| 2025-08-01 | 4.24% |
| 2025-07-01 | 3.08% |
| 2025-06-01 | 2.85% |
| 2025-05-01 | 2.9% |
| 2025-04-01 | 2.85% |
| 2025-03-01 | 2.85% |
| 2025-02-01 | 2.89% |
| 2025-01-01 | 2.96% |
| 2024-12-01 | 2.76% |
| 2024-11-01 | 2.48% |
| 2024-10-01 | 2.34% |
| 2024-09-01 | 2.48% |
| 2024-08-01 | 2.54% |
| 2024-07-01 | 2.44% |
| 2024-06-01 | 2.35% |
| 2024-05-01 | 2.23% |
| 2024-04-01 | 2.47% |
| 2024-03-01 | 2.85% |
| 2024-02-01 | 3.29% |
| 2024-01-01 | 2.97% |
| 2023-12-01 | 2.46% |
| 2023-11-01 | 1.99% |
| 2023-10-01 | 2.01% |
| 2023-09-01 | 1.99% |
| 2023-08-01 | 1.9% |
| 2023-07-01 | 1.83% |
| 2023-06-01 | 1.81% |
| 2023-05-01 | 1.69% |
| 2023-04-01 | 1.77% |
| 2023-03-01 | 1.63% |
| 2023-02-01 | 1.57% |
| 2023-01-01 | 1.29% |
| 2022-12-01 | 1.25% |
| 2022-11-01 | 1.3% |
| 2022-10-01 | 1.41% |
| 2022-09-01 | 1.54% |
| 2022-08-01 | 1.57% |
| 2022-07-01 | 1.91% |
| 2022-06-01 | 2.56% |
| 2022-05-01 | 3.77% |
| 2022-04-01 | 4.09% |
| 2022-03-01 | 3.85% |
| 2022-02-01 | 2.86% |
| 2022-01-01 | 2.34% |
| 2021-12-01 | 2.02% |
| 2021-11-01 | 2.02% |
| 2021-10-01 | 2.07% |
| 2021-09-01 | 2.04% |
| 2021-08-01 | 2% |
| 2021-07-01 | 1.81% |
| 2021-06-01 | 1.73% |
| 2021-05-01 | 1.55% |
| 2021-04-01 | 1.54% |
| 2021-03-01 | 1.54% |
| 2021-02-01 | 1.57% |
| 2021-01-01 | 1.62% |
| 2020-12-01 | 1.64% |
| 2020-11-01 | 2.2% |
| 2020-10-01 | 2.85% |
| 2020-09-01 | 3.67% |
| 2020-08-01 | 3.65% |
| 2020-07-01 | 3.52% |
| 2020-06-01 | 2.78% |
| 2020-05-01 | 2.31% |
| 2020-04-01 | 1.81% |
| 2020-03-01 | 1.7% |
| 2020-02-01 | 1.59% |
| 2020-01-01 | 1.47% |
| 2019-12-01 | 1.55% |
| 2019-11-01 | 1.51% |
| 2019-10-01 | 1.53% |
| 2019-09-01 | 1.4% |
| 2019-08-01 | 1.39% |
| 2019-07-01 | 1.36% |
| 2019-06-01 | 1.34% |
| 2019-05-01 | 1.34% |
| 2019-04-01 | 1.35% |
| 2019-03-01 | 1.39% |
| 2019-02-01 | 1.56% |
| 2019-01-01 | 1.6% |
| 2018-12-01 | 1.62% |
| 2018-11-01 | 1.49% |
| 2018-10-01 | 1.53% |
| 2018-09-01 | 1.59% |
| 2018-08-01 | 1.72% |
| 2018-07-01 | 1.77% |
| 2018-06-01 | 1.82% |
| 2018-05-01 | 1.83% |
| 2018-04-01 | 1.89% |
| 2018-03-01 | 1.85% |
| 2018-02-01 | 1.87% |
| 2018-01-01 | 1.72% |
| 2017-12-01 | 1.63% |
| 2017-11-01 | 1.46% |
| 2017-10-01 | 1.5% |
| 2017-09-01 | 1.52% |
| 2017-08-01 | 1.56% |
| 2017-07-01 | 1.56% |
| 2017-06-01 | 1.55% |
| 2017-05-01 | 1.52% |
| 2017-04-01 | 1.5% |
| 2017-03-01 | 1.53% |
| 2017-02-01 | 1.55% |
| 2017-01-01 | 1.56% |
| 2016-12-01 | 1.53% |
| 2016-11-01 | 1.62% |
| 2016-10-01 | 1.67% |
| 2016-09-01 | 1.67% |
| 2016-08-01 | 1.61% |
| 2016-07-01 | 1.61% |
| 2016-06-01 | 1.69% |
| 2016-05-01 | 1.76% |
| 2016-04-01 | 1.82% |
| 2016-03-01 | 1.78% |
| 2016-02-01 | 1.76% |
| 2016-01-01 | 1.85% |
| 2015-12-01 | 1.89% |
| 2015-11-01 | 1.8% |
| 2015-10-01 | 1.6% |
| 2015-09-01 | 1.47% |
| 2015-08-01 | 1.48% |
| 2015-07-01 | 1.53% |
| 2015-06-01 | 1.61% |
| 2015-05-01 | 1.64% |
| 2015-04-01 | 1.58% |
| 2015-03-01 | 1.56% |
| 2015-02-01 | 1.47% |
| 2015-01-01 | 1.46% |
| 2014-12-01 | 1.4% |
| 2014-11-01 | 1.38% |
| 2014-10-01 | 1.32% |
| 2014-09-01 | 1.26% |
| 2014-08-01 | 1.23% |
| 2014-07-01 | 1.38% |
| 2014-06-01 | 1.39% |
| 2014-05-01 | 1.37% |
| 2014-04-01 | 1.18% |
| 2014-03-01 | 1.12% |
| 2014-02-01 | 1.09% |
| 2014-01-01 | 1.07% |
| 2013-12-01 | 1.06% |
| 2013-11-01 | 1.07% |
| 2013-10-01 | 1.08% |
| 2013-09-01 | 1.11% |
| 2013-08-01 | 1.13% |
| 2013-07-01 | 1.15% |
| 2013-06-01 | 1.14% |
| 2013-05-01 | 1.12% |
| 2013-04-01 | 1.07% |
| 2013-03-01 | 1.02% |
| 2013-02-01 | 1% |
| 2013-01-01 | 1.06% |
| 2012-12-01 | 1.11% |
| 2012-11-01 | 1.14% |
| 2012-10-01 | 1.11% |
| 2012-09-01 | 1.08% |
| 2012-08-01 | 1.1% |
| 2012-07-01 | 1.14% |
| 2012-06-01 | 1.15% |
| 2012-05-01 | 1.14% |
| 2012-04-01 | 1.13% |
| 2012-03-01 | 1.11% |
| 2012-02-01 | 1.09% |
| 2012-01-01 | 1.11% |
| 2011-12-01 | 1.15% |
| 2011-11-01 | 1.2% |
| 2011-10-01 | 1.22% |
| 2011-09-01 | 1.22% |
| 2011-08-01 | 1.22% |
| 2011-07-01 | 1.2% |
| 2011-06-01 | 1.18% |
| 2011-05-01 | 1.16% |
| 2011-04-01 | 1.13% |
| 2011-03-01 | 1.09% |
| 2011-02-01 | 1.09% |
| 2011-01-01 | 1.11% |
| 2010-12-01 | 1.13% |
| 2010-11-01 | 1.15% |
| 2010-10-01 | 1.17% |
| 2010-09-01 | 1.22% |
| 2010-08-01 | 1.31% |
| 2010-07-01 | 1.37% |
| 2010-06-01 | 1.39% |
| 2010-05-01 | 1.32% |
| 2010-04-01 | 1.24% |
| 2010-03-01 | 1.18% |
| 2010-02-01 | 1.18% |
| 2010-01-01 | 1.24% |
| 2009-12-01 | 1.23% |
| 2009-11-01 | 1.23% |
| 2009-10-01 | 1.22% |
| 2009-09-01 | 1.33% |
| 2009-08-01 | 1.39% |
| 2009-07-01 | 1.29% |
| 2009-06-01 | 1.11% |
| 2009-05-01 | 0.91% |
| 2009-04-01 | 0.82% |
| 2009-03-01 | 0.77% |
| 2009-02-01 | 0.75% |
Picture: PNG · SVG · other formats
| Date | Desktop |
|---|---|
| 2026-10-01 | 56.47% |
| 2026-09-01 | 56.03% |
| 2026-08-01 | 61.28% |
| 2026-07-01 | 61.24% |
| 2026-06-01 | 61.14% |
| 2026-05-01 | 66.71% |
| 2026-04-01 | 56.87% |
| 2026-03-01 | 57.55% |
| 2026-02-01 | 60.73% |
| 2026-01-01 | 62.84% |
| 2025-12-01 | 62.12% |
| 2025-11-01 | 63.77% |
| 2025-10-01 | 64.46% |
| 2025-09-01 | 61.71% |
Picture: PNG · SVG · other formats
| Date | Flathub downloads |
|---|---|
| 2026-11-09 | 714.3k |
| 2026-11-02 | 766.7k |
| 2026-10-26 | 1052k |
| 2026-10-19 | 1284.9k |
| 2026-10-12 | 962.3k |
| 2026-10-05 | 698.3k |
| 2026-09-28 | 801.1k |
| 2026-09-21 | 743.8k |
| 2026-09-14 | 967.7k |
| 2026-09-07 | 587.8k |
| 2026-08-31 | 575.2k |
| 2026-08-24 | 571k |
| 2026-08-17 | 681.9k |
| 2026-08-10 | 656.9k |
Picture: PNG · SVG · other formats
| Date | pkgstats submissions |
|---|---|
| 2026-10-01 | 1114 |
| 2026-09-01 | 959 |
| 2026-08-01 | 972 |
| 2026-07-01 | 987 |
| 2026-06-01 | 1025 |
| 2026-05-01 | 1010 |
| 2026-04-01 | 826 |
| 2026-03-01 | 814 |
| 2026-02-01 | 737 |
| 2026-01-01 | 553 |
| 2025-12-01 | 642 |
| 2025-11-01 | 599 |
| 2025-10-01 | 436 |
| 2025-09-01 | 430 |
| 2025-08-01 | 354 |
| 2025-07-01 | 292 |
| 2025-06-01 | 284 |
| 2025-05-01 | 288 |
| 2025-04-01 | 290 |
| 2025-03-01 | 306 |
| 2025-02-01 | 262 |
| 2025-01-01 | 293 |
| 2024-12-01 | 277 |
| 2024-11-01 | 282 |
| 2024-10-01 | 407 |
| 2024-09-01 | 355 |
| 2024-08-01 | 363 |
| 2024-07-01 | 403 |
| 2024-06-01 | 360 |
| 2024-05-01 | 385 |
| 2024-04-01 | 420 |
| 2024-03-01 | 356 |
| 2024-02-01 | 353 |
| 2024-01-01 | 441 |
| 2023-12-01 | 349 |
| 2023-11-01 | 388 |
| 2023-10-01 | 402 |
| 2023-09-01 | 362 |
| 2023-08-01 | 385 |
| 2023-07-01 | 375 |
| 2023-06-01 | 362 |
| 2023-05-01 | 399 |
| 2023-04-01 | 360 |
| 2023-03-01 | 390 |
| 2023-02-01 | 341 |
| 2023-01-01 | 367 |
| 2022-12-01 | 332 |
| 2022-11-01 | 370 |
| 2022-10-01 | 330 |
| 2022-09-01 | 349 |
| 2022-08-01 | 343 |
| 2022-07-01 | 325 |
| 2022-06-01 | 303 |
| 2022-05-01 | 372 |
| 2022-04-01 | 334 |
| 2022-03-01 | 356 |
| 2022-02-01 | 364 |
| 2022-01-01 | 360 |
| 2021-12-01 | 356 |
| 2021-11-01 | 376 |
| 2021-10-01 | 331 |
| 2021-09-01 | 331 |
| 2021-08-01 | 361 |
| 2021-07-01 | 338 |
| 2021-06-01 | 366 |
| 2021-05-01 | 366 |
| 2021-04-01 | 375 |
| 2021-03-01 | 419 |
| 2021-02-01 | 350 |
| 2021-01-01 | 350 |
| 2020-12-01 | 412 |
| 2020-11-01 | 393 |
| 2020-10-01 | 383 |
| 2020-09-01 | 397 |
| 2020-08-01 | 403 |
| 2020-07-01 | 418 |
| 2020-06-01 | 468 |
| 2020-05-01 | 399 |
| 2020-04-01 | 402 |
| 2020-03-01 | 411 |
| 2020-02-01 | 337 |
| 2020-01-01 | 332 |
| 2019-12-01 | 349 |
| 2019-11-01 | 299 |
| 2019-10-01 | 322 |
| 2019-09-01 | 271 |
| 2019-08-01 | 210 |
| 2019-07-01 | 219 |
| 2019-06-01 | 208 |
| 2019-05-01 | 188 |
| 2019-04-01 | 192 |
| 2019-03-01 | 119 |
| 2019-02-01 | 144 |
| 2019-01-01 | 156 |
| 2018-12-01 | 205 |
| 2018-11-01 | 199 |
| 2018-10-01 | 246 |
| 2018-09-01 | 210 |
| 2018-08-01 | 224 |
| 2018-07-01 | 258 |
| 2018-06-01 | 202 |
| 2018-05-01 | 190 |
| 2018-04-01 | 245 |
| 2018-03-01 | 179 |
| 2018-02-01 | 196 |
| 2018-01-01 | 253 |
Picture: PNG · SVG · other formats
Large countries naturally send many downloads. To compare them, Flathub downloads and Arch pkgstats submissions are divided by an estimate of the people who use a computer – not of all internet users, because in many countries most people go online with a phone.
PC users ≈ internet users × desktop share of page views. Internet users come from the World Bank (share of the population online × population, newest year, CC BY 4.0); the desktop share is StatCounter's split of page views between desktop, mobile and tablet, averaged over the last twelve months without artefact months.
This is a rough yardstick, not a count: page views are not people, one person may use a phone and a PC, and heavy desktop users weigh more. Countries with fewer than 1 million estimated PC users get no per-million figure. Taiwan has no World Bank figure.