Linux share
8.6%
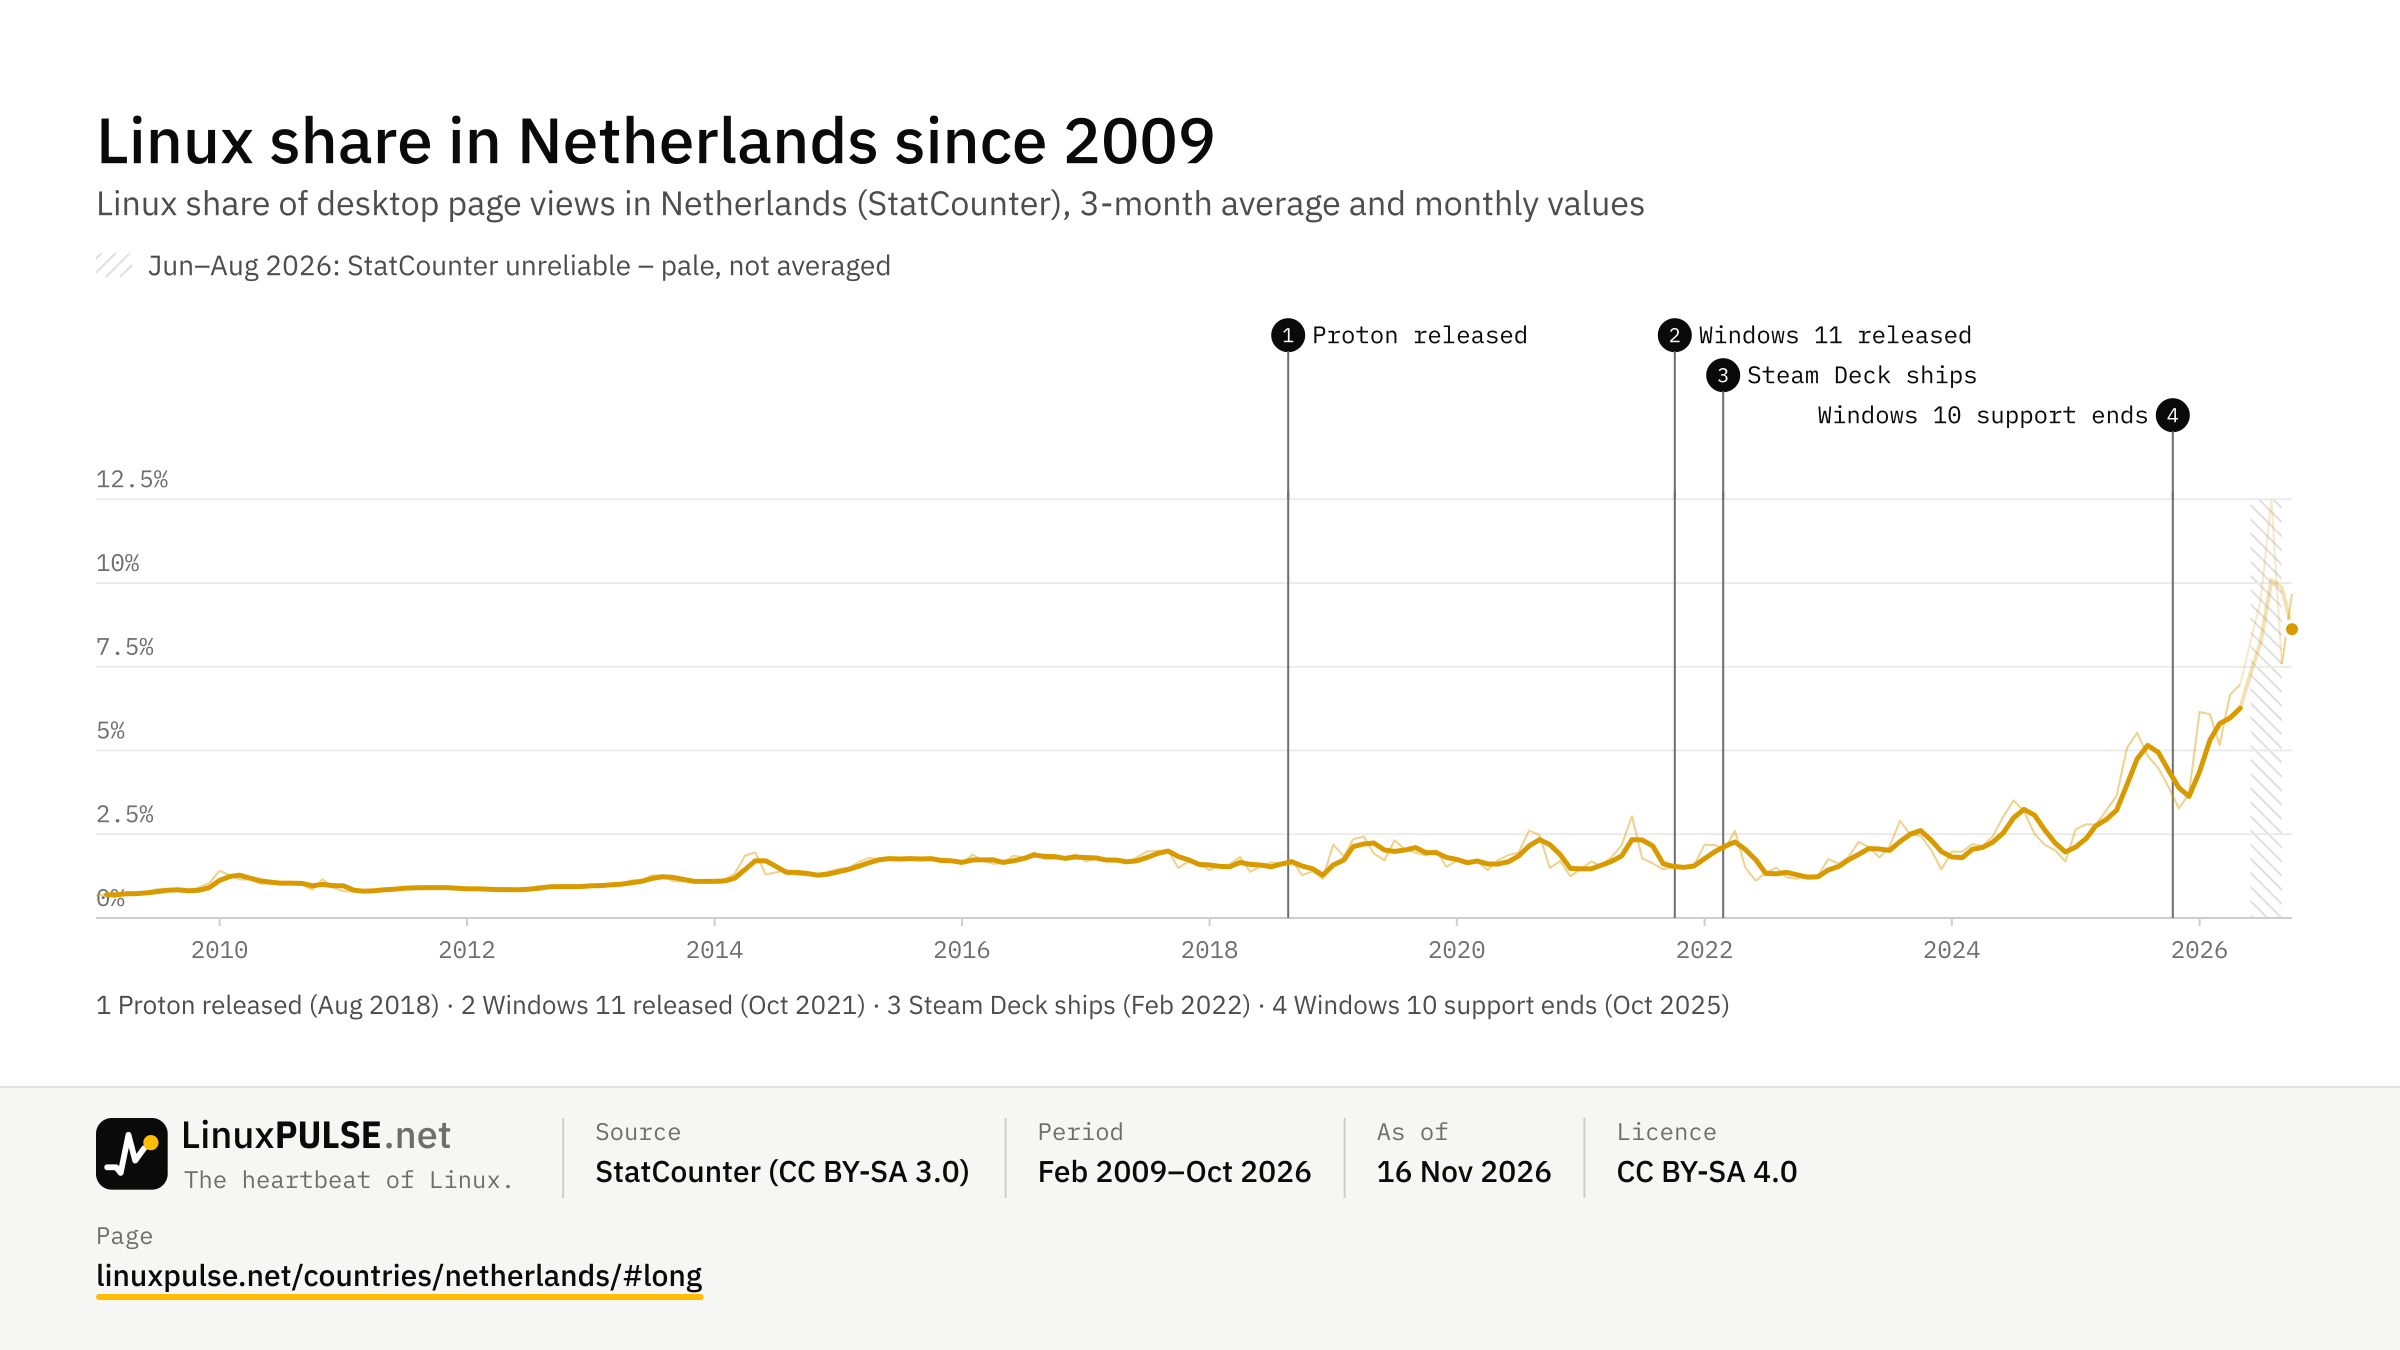
↗ +4.4 pp vs a year agoStatCounter · desktop page views · Sep–Oct 2026Netherlands: 8.6 % over the last three months, up from a year ago (+4.4 pp).
Linux share
8.6%
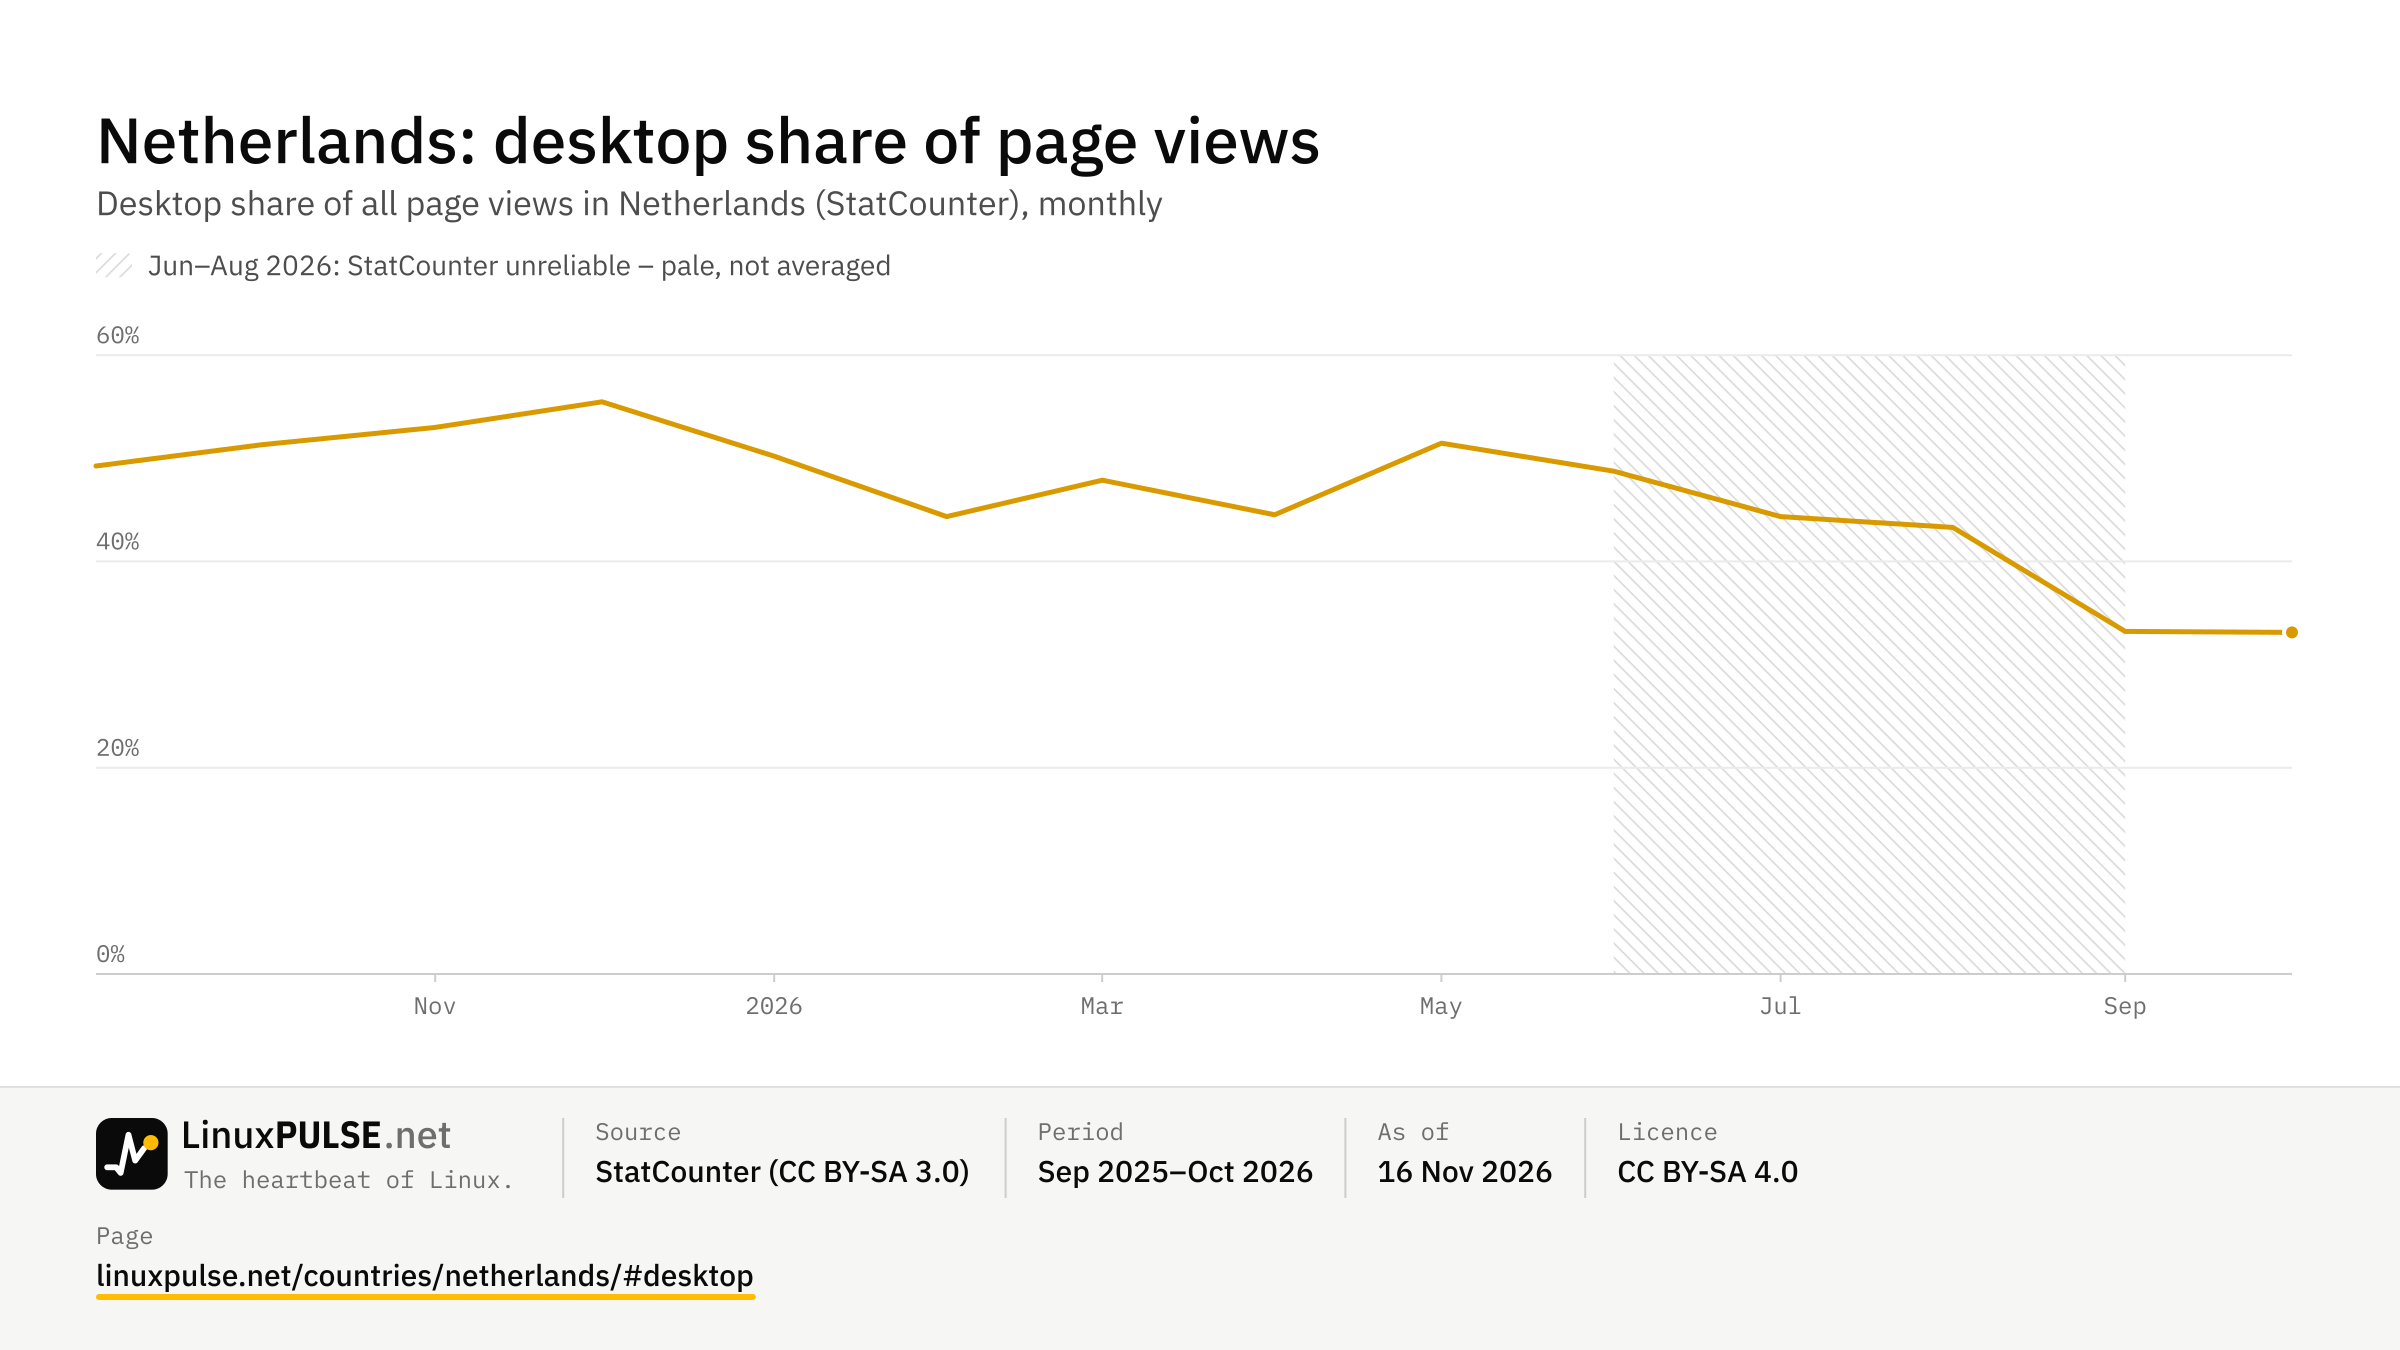
↗ +4.4 pp vs a year agoStatCounter · desktop page views · Sep–Oct 2026Desktop share of page views
47%
StatCounter · desktop vs mobile vs tablet · Sep 2025–May 2026, Sep 2026–Oct 2026PC users (estimate)
8.2M
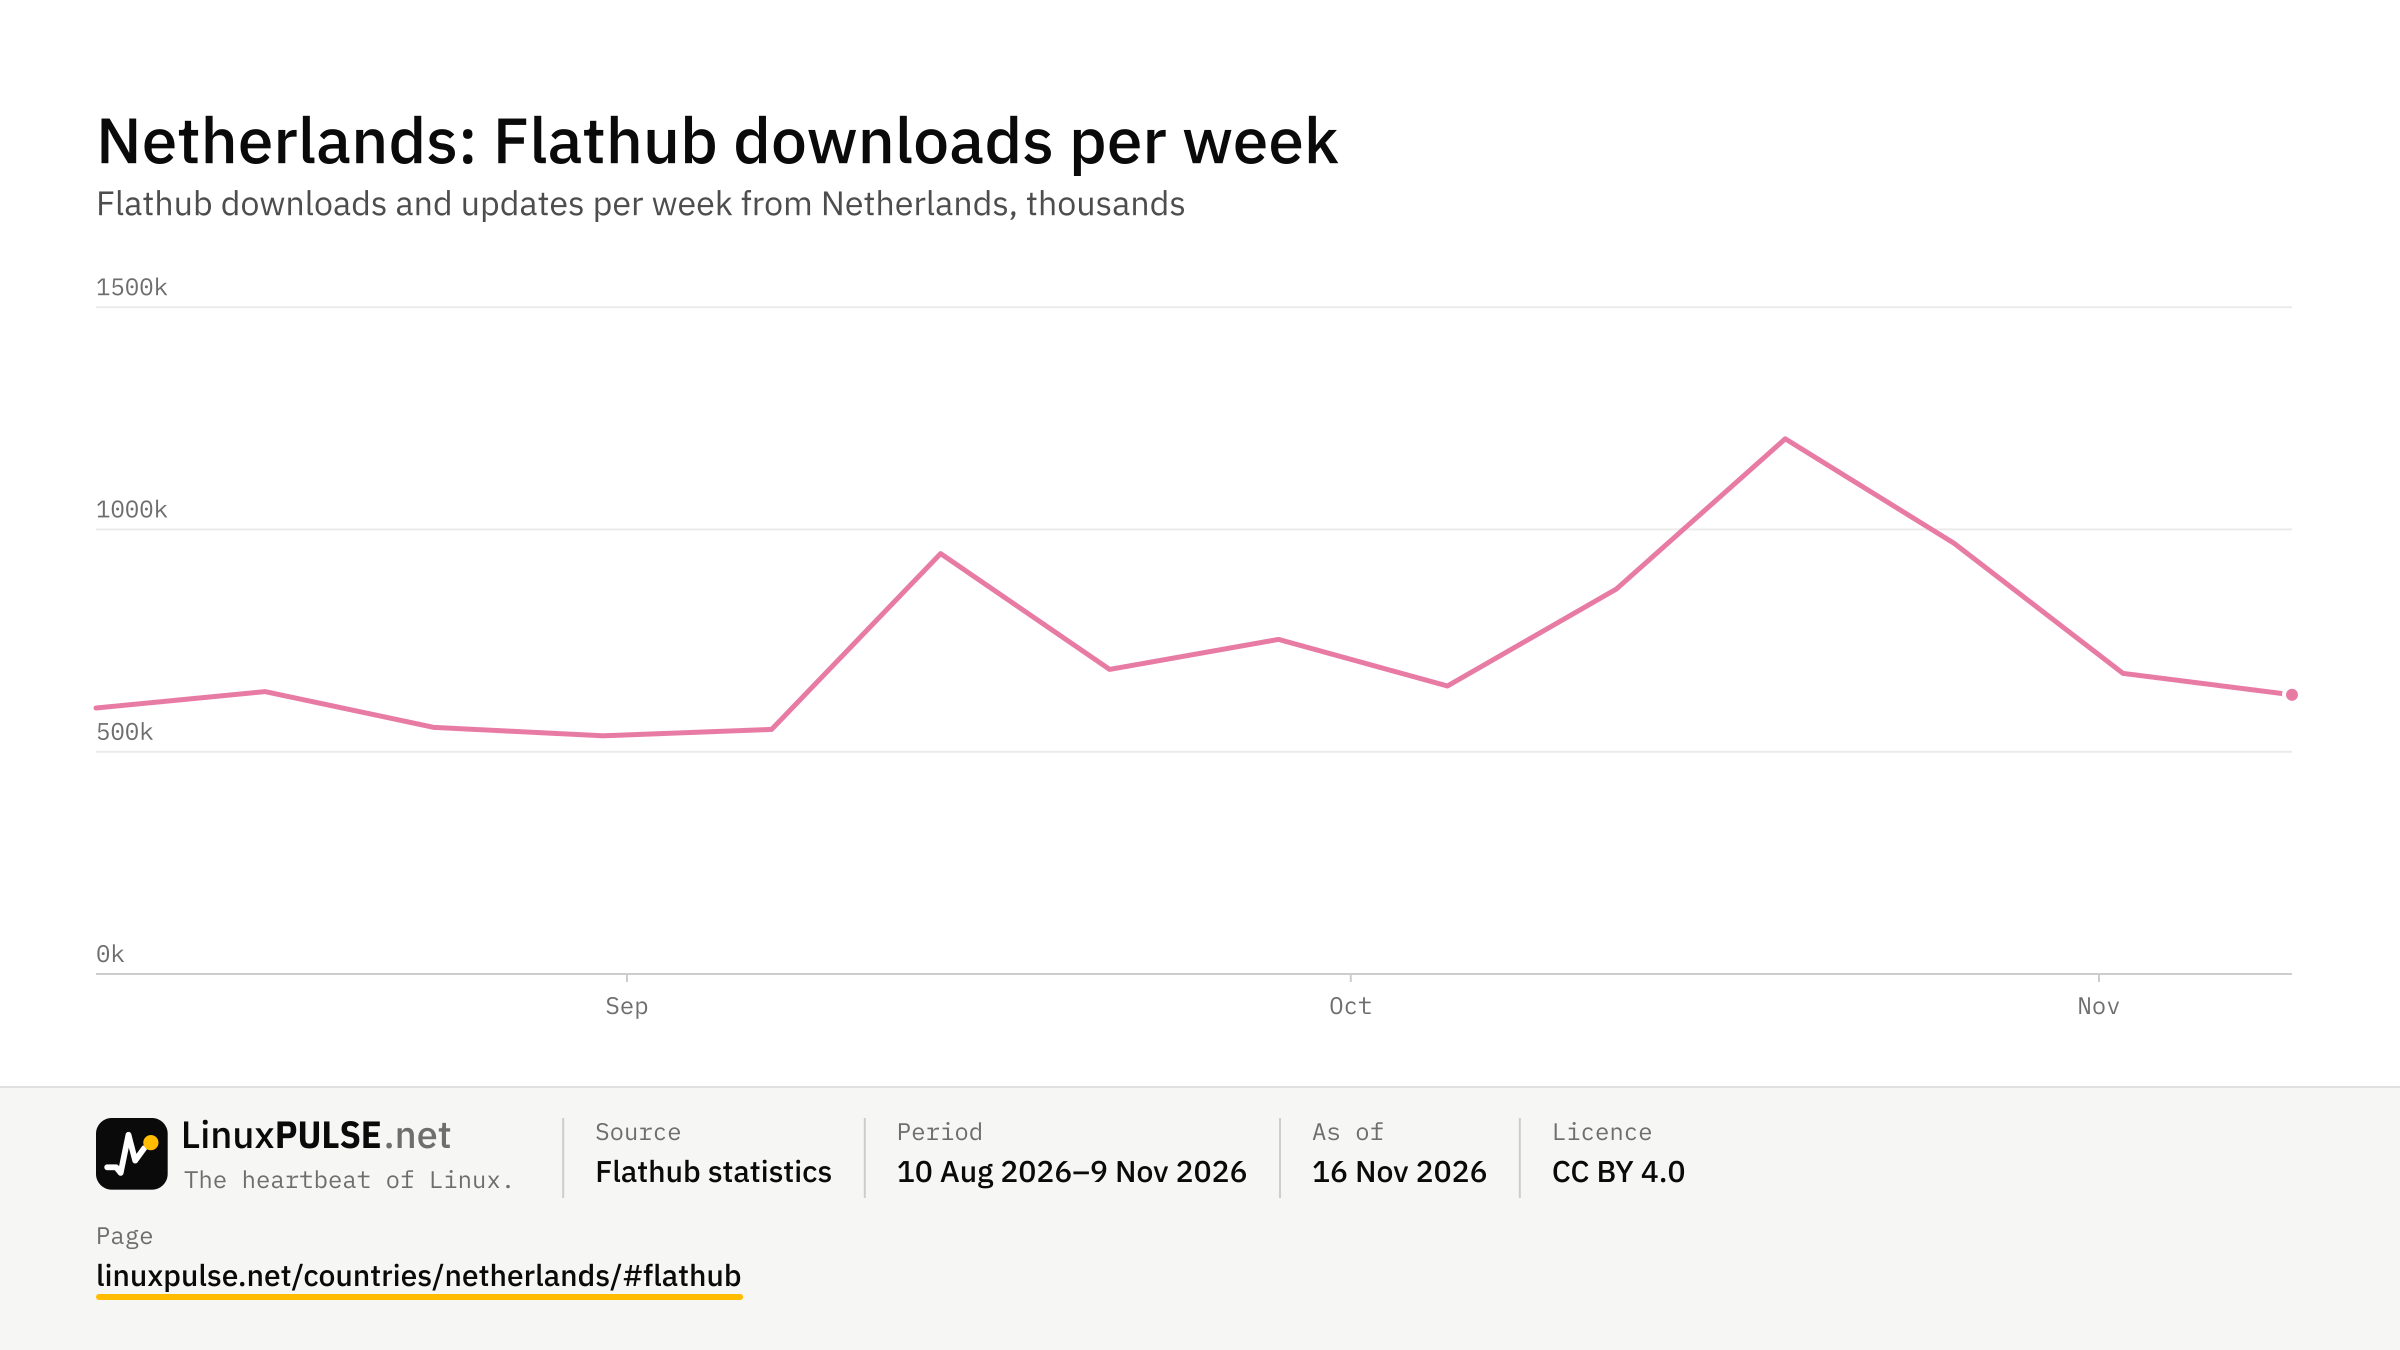
17.5M internet users (2024) · × desktop shareFlathub downloads per week
628K
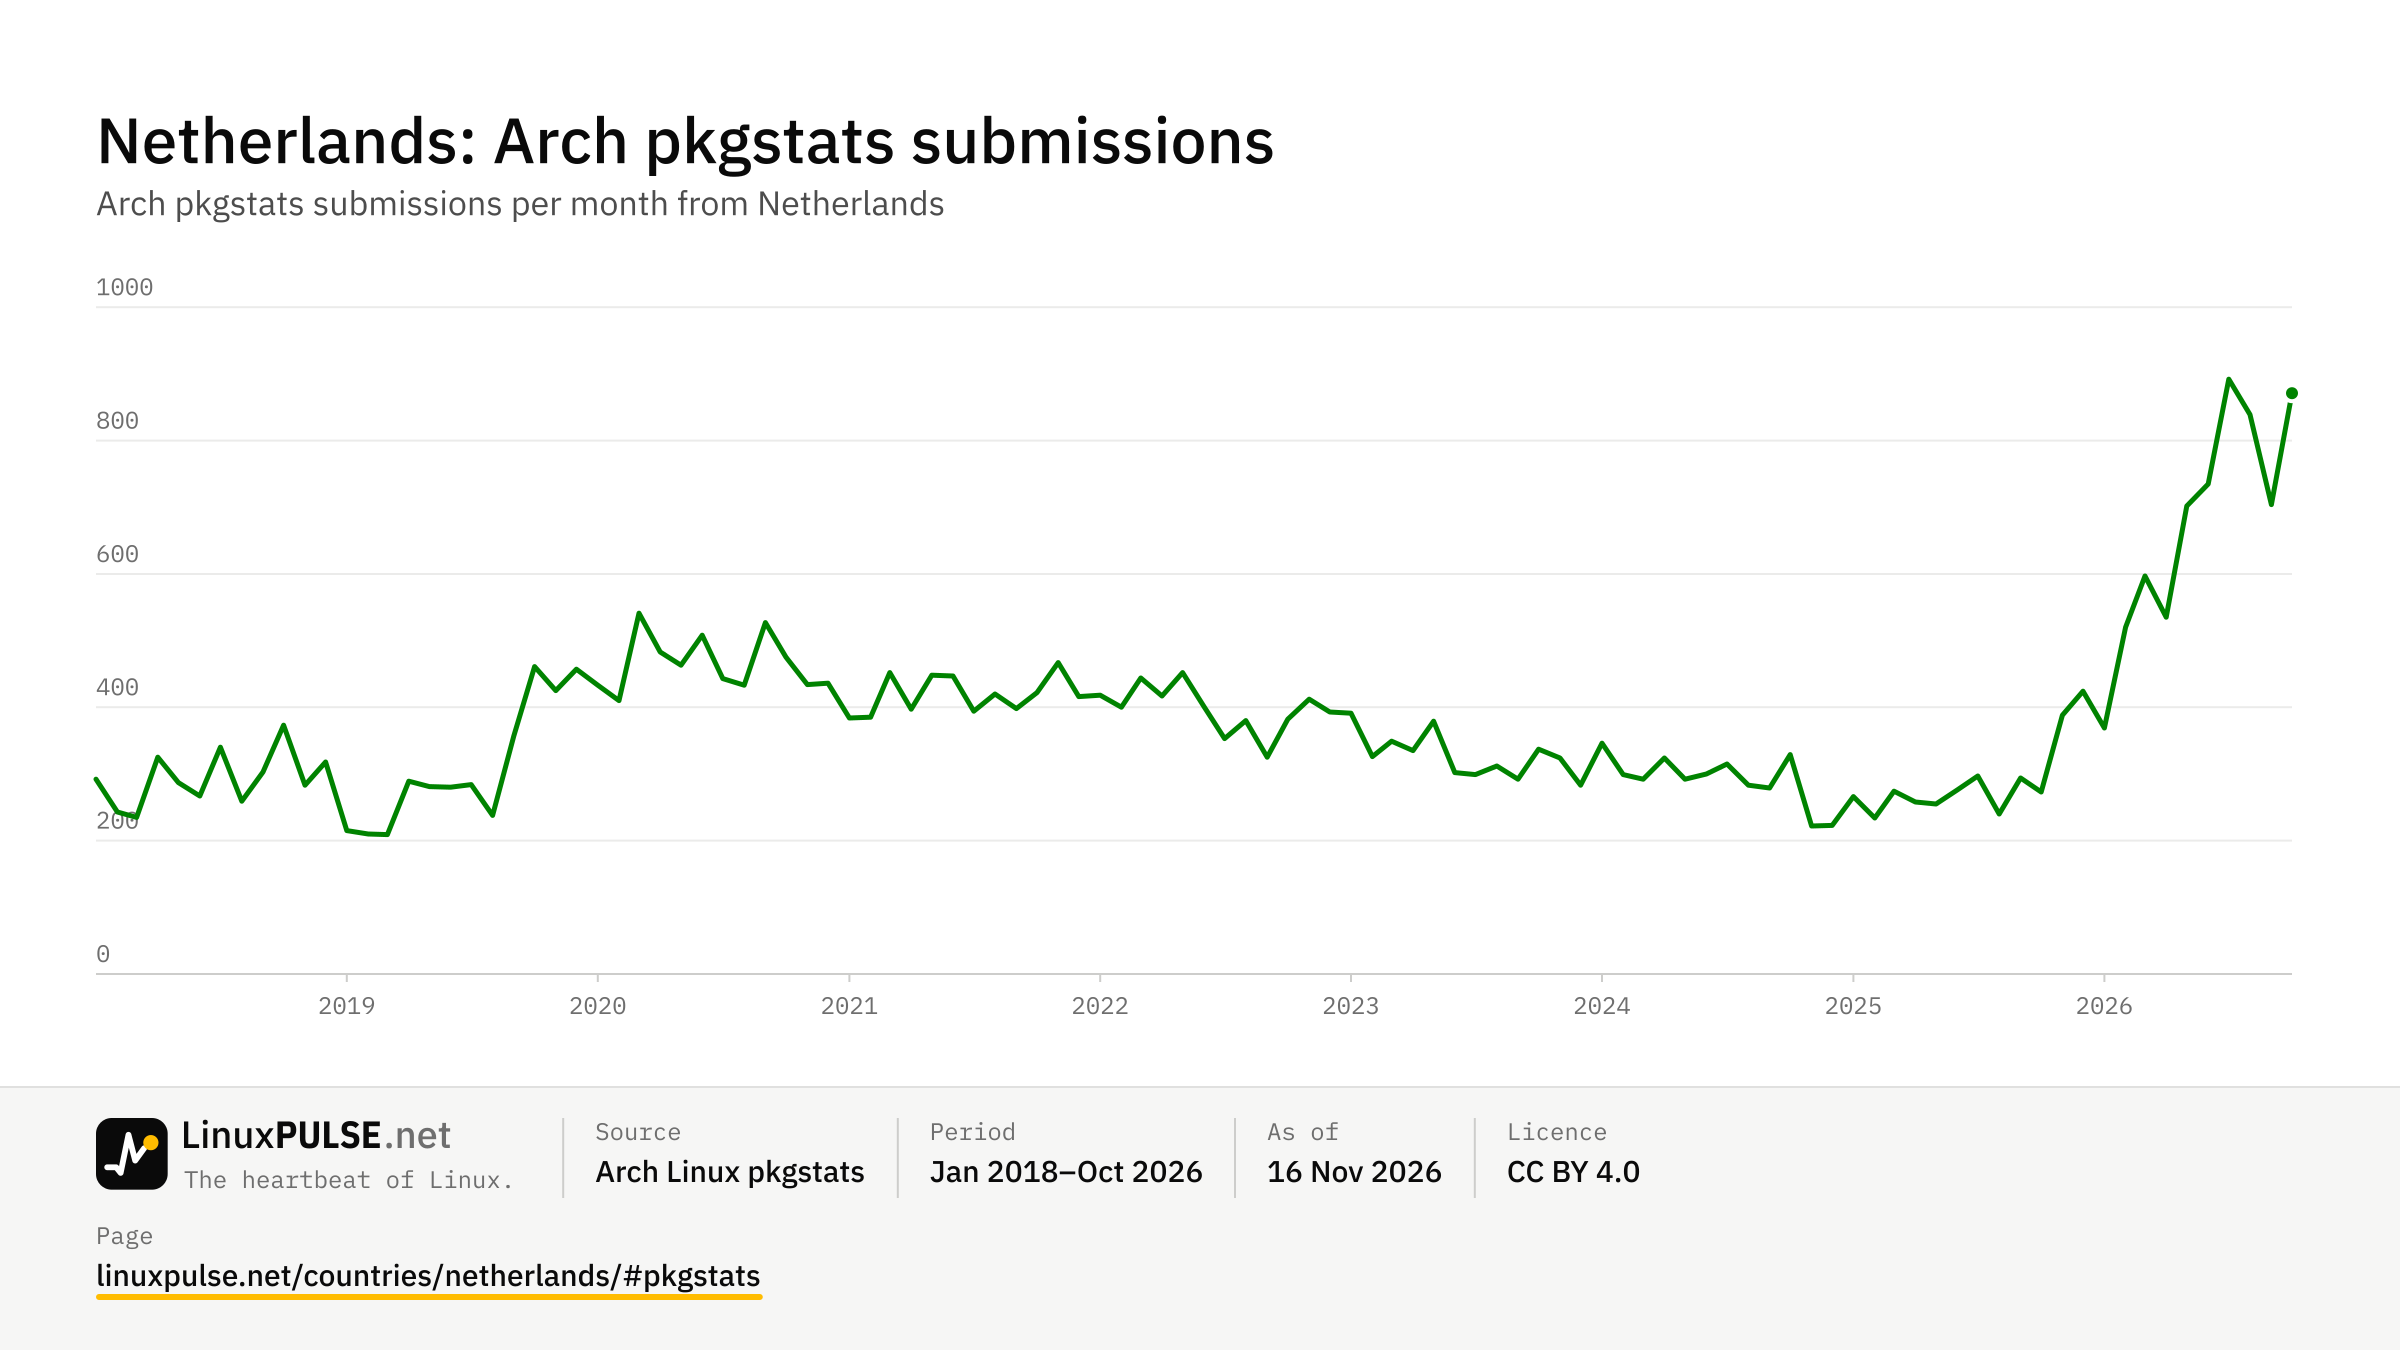
Flathub · week of 9 Nov 2026Arch pkgstats submissions
871
pkgstats · October 2026| Date | Netherlands |
|---|---|
| 2026-10-01 | 8.62% |
| 2026-05-01 | 6.26% |
| 2026-04-01 | 5.97% |
| 2026-03-01 | 5.8% |
| 2026-02-01 | 5.31% |
| 2026-01-01 | 4.37% |
| 2025-12-01 | 3.63% |
| 2025-11-01 | 3.89% |
| 2025-10-01 | 4.41% |
| 2025-09-01 | 4.95% |
| 2025-08-01 | 5.15% |
| 2025-07-01 | 4.75% |
| 2025-06-01 | 3.98% |
| 2025-05-01 | 3.22% |
| 2025-04-01 | 2.94% |
| 2025-03-01 | 2.75% |
| 2025-02-01 | 2.38% |
| 2025-01-01 | 2.12% |
| 2024-12-01 | 1.97% |
| 2024-11-01 | 2.24% |
| 2024-10-01 | 2.63% |
| 2024-09-01 | 3.07% |
| 2024-08-01 | 3.24% |
| 2024-07-01 | 2.99% |
| 2024-06-01 | 2.54% |
| 2024-05-01 | 2.26% |
| 2024-04-01 | 2.11% |
| 2024-03-01 | 2.05% |
| 2024-02-01 | 1.8% |
| 2024-01-01 | 1.82% |
| 2023-12-01 | 1.98% |
| 2023-11-01 | 2.32% |
| 2023-10-01 | 2.61% |
| 2023-09-01 | 2.51% |
| 2023-08-01 | 2.28% |
| 2023-07-01 | 2.02% |
| 2023-06-01 | 2.06% |
| 2023-05-01 | 2.07% |
| 2023-04-01 | 1.9% |
| 2023-03-01 | 1.73% |
| 2023-02-01 | 1.54% |
| 2023-01-01 | 1.43% |
| 2022-12-01 | 1.23% |
| 2022-11-01 | 1.22% |
| 2022-10-01 | 1.29% |
| 2022-09-01 | 1.36% |
| 2022-08-01 | 1.32% |
| 2022-07-01 | 1.33% |
| 2022-06-01 | 1.74% |
| 2022-05-01 | 2.05% |
| 2022-04-01 | 2.27% |
| 2022-03-01 | 2.14% |
| 2022-02-01 | 1.98% |
| 2022-01-01 | 1.77% |
| 2021-12-01 | 1.55% |
| 2021-11-01 | 1.51% |
| 2021-10-01 | 1.54% |
| 2021-09-01 | 1.62% |
| 2021-08-01 | 2.15% |
| 2021-07-01 | 2.33% |
| 2021-06-01 | 2.34% |
| 2021-05-01 | 1.85% |
| 2021-04-01 | 1.69% |
| 2021-03-01 | 1.57% |
| 2021-02-01 | 1.47% |
| 2021-01-01 | 1.47% |
| 2020-12-01 | 1.48% |
| 2020-11-01 | 1.89% |
| 2020-10-01 | 2.19% |
| 2020-09-01 | 2.34% |
| 2020-08-01 | 2.15% |
| 2020-07-01 | 1.85% |
| 2020-06-01 | 1.68% |
| 2020-05-01 | 1.61% |
| 2020-04-01 | 1.61% |
| 2020-03-01 | 1.7% |
| 2020-02-01 | 1.65% |
| 2020-01-01 | 1.75% |
| 2019-12-01 | 1.81% |
| 2019-11-01 | 1.95% |
| 2019-10-01 | 1.95% |
| 2019-09-01 | 2.1% |
| 2019-08-01 | 2.03% |
| 2019-07-01 | 1.99% |
| 2019-06-01 | 2.03% |
| 2019-05-01 | 2.24% |
| 2019-04-01 | 2.21% |
| 2019-03-01 | 2.13% |
| 2019-02-01 | 1.73% |
| 2019-01-01 | 1.58% |
| 2018-12-01 | 1.28% |
| 2018-11-01 | 1.47% |
| 2018-10-01 | 1.55% |
| 2018-09-01 | 1.68% |
| 2018-08-01 | 1.61% |
| 2018-07-01 | 1.53% |
| 2018-06-01 | 1.58% |
| 2018-05-01 | 1.6% |
| 2018-04-01 | 1.66% |
| 2018-03-01 | 1.53% |
| 2018-02-01 | 1.54% |
| 2018-01-01 | 1.58% |
| 2017-12-01 | 1.6% |
| 2017-11-01 | 1.73% |
| 2017-10-01 | 1.83% |
| 2017-09-01 | 2% |
| 2017-08-01 | 1.93% |
| 2017-07-01 | 1.81% |
| 2017-06-01 | 1.71% |
| 2017-05-01 | 1.68% |
| 2017-04-01 | 1.73% |
| 2017-03-01 | 1.73% |
| 2017-02-01 | 1.79% |
| 2017-01-01 | 1.8% |
| 2016-12-01 | 1.82% |
| 2016-11-01 | 1.78% |
| 2016-10-01 | 1.83% |
| 2016-09-01 | 1.84% |
| 2016-08-01 | 1.88% |
| 2016-07-01 | 1.77% |
| 2016-06-01 | 1.71% |
| 2016-05-01 | 1.66% |
| 2016-04-01 | 1.74% |
| 2016-03-01 | 1.74% |
| 2016-02-01 | 1.73% |
| 2016-01-01 | 1.66% |
| 2015-12-01 | 1.71% |
| 2015-11-01 | 1.72% |
| 2015-10-01 | 1.77% |
| 2015-09-01 | 1.76% |
| 2015-08-01 | 1.77% |
| 2015-07-01 | 1.76% |
| 2015-06-01 | 1.77% |
| 2015-05-01 | 1.74% |
| 2015-04-01 | 1.65% |
| 2015-03-01 | 1.54% |
| 2015-02-01 | 1.45% |
| 2015-01-01 | 1.38% |
| 2014-12-01 | 1.31% |
| 2014-11-01 | 1.28% |
| 2014-10-01 | 1.33% |
| 2014-09-01 | 1.36% |
| 2014-08-01 | 1.36% |
| 2014-07-01 | 1.54% |
| 2014-06-01 | 1.71% |
| 2014-05-01 | 1.71% |
| 2014-04-01 | 1.45% |
| 2014-03-01 | 1.19% |
| 2014-02-01 | 1.11% |
| 2014-01-01 | 1.09% |
| 2013-12-01 | 1.09% |
| 2013-11-01 | 1.09% |
| 2013-10-01 | 1.15% |
| 2013-09-01 | 1.21% |
| 2013-08-01 | 1.23% |
| 2013-07-01 | 1.18% |
| 2013-06-01 | 1.1% |
| 2013-05-01 | 1.05% |
| 2013-04-01 | 1.01% |
| 2013-03-01 | 0.99% |
| 2013-02-01 | 0.97% |
| 2013-01-01 | 0.96% |
| 2012-12-01 | 0.94% |
| 2012-11-01 | 0.94% |
| 2012-10-01 | 0.94% |
| 2012-09-01 | 0.93% |
| 2012-08-01 | 0.89% |
| 2012-07-01 | 0.86% |
| 2012-06-01 | 0.84% |
| 2012-05-01 | 0.85% |
| 2012-04-01 | 0.85% |
| 2012-03-01 | 0.86% |
| 2012-02-01 | 0.87% |
| 2012-01-01 | 0.87% |
| 2011-12-01 | 0.89% |
| 2011-11-01 | 0.91% |
| 2011-10-01 | 0.91% |
| 2011-09-01 | 0.91% |
| 2011-08-01 | 0.9% |
| 2011-07-01 | 0.89% |
| 2011-06-01 | 0.86% |
| 2011-05-01 | 0.84% |
| 2011-04-01 | 0.81% |
| 2011-03-01 | 0.8% |
| 2011-02-01 | 0.83% |
| 2011-01-01 | 0.96% |
| 2010-12-01 | 0.97% |
| 2010-11-01 | 1% |
| 2010-10-01 | 0.96% |
| 2010-09-01 | 1.03% |
| 2010-08-01 | 1.04% |
| 2010-07-01 | 1.04% |
| 2010-06-01 | 1.07% |
| 2010-05-01 | 1.11% |
| 2010-04-01 | 1.19% |
| 2010-03-01 | 1.28% |
| 2010-02-01 | 1.24% |
| 2010-01-01 | 1.12% |
| 2009-12-01 | 0.91% |
| 2009-11-01 | 0.83% |
| 2009-10-01 | 0.81% |
| 2009-09-01 | 0.84% |
| 2009-08-01 | 0.83% |
| 2009-07-01 | 0.79% |
| 2009-06-01 | 0.75% |
| 2009-05-01 | 0.73% |
| 2009-04-01 | 0.72% |
| 2009-03-01 | 0.69% |
| 2009-02-01 | 0.69% |
Picture: PNG · SVG · other formats
| Date | Desktop |
|---|---|
| 2026-10-01 | 33.12% |
| 2026-09-01 | 33.22% |
| 2026-08-01 | 43.31% |
| 2026-07-01 | 44.35% |
| 2026-06-01 | 48.76% |
| 2026-05-01 | 51.46% |
| 2026-04-01 | 44.53% |
| 2026-03-01 | 47.88% |
| 2026-02-01 | 44.35% |
| 2026-01-01 | 50.2% |
| 2025-12-01 | 55.49% |
| 2025-11-01 | 52.99% |
| 2025-10-01 | 51.33% |
| 2025-09-01 | 49.25% |
Picture: PNG · SVG · other formats
| Date | Flathub downloads |
|---|---|
| 2026-11-09 | 628k |
| 2026-11-02 | 676.2k |
| 2026-10-26 | 968.5k |
| 2026-10-19 | 1203.9k |
| 2026-10-12 | 866.2k |
| 2026-10-05 | 648k |
| 2026-09-28 | 752.8k |
| 2026-09-21 | 685.1k |
| 2026-09-14 | 945.8k |
| 2026-09-07 | 550.1k |
| 2026-08-31 | 536k |
| 2026-08-24 | 554.6k |
| 2026-08-17 | 635.1k |
| 2026-08-10 | 598.6k |
Picture: PNG · SVG · other formats
| Date | pkgstats submissions |
|---|---|
| 2026-10-01 | 871 |
| 2026-09-01 | 704 |
| 2026-08-01 | 839 |
| 2026-07-01 | 892 |
| 2026-06-01 | 735 |
| 2026-05-01 | 702 |
| 2026-04-01 | 535 |
| 2026-03-01 | 597 |
| 2026-02-01 | 520 |
| 2026-01-01 | 369 |
| 2025-12-01 | 424 |
| 2025-11-01 | 388 |
| 2025-10-01 | 273 |
| 2025-09-01 | 294 |
| 2025-08-01 | 240 |
| 2025-07-01 | 297 |
| 2025-06-01 | 276 |
| 2025-05-01 | 255 |
| 2025-04-01 | 258 |
| 2025-03-01 | 274 |
| 2025-02-01 | 234 |
| 2025-01-01 | 266 |
| 2024-12-01 | 223 |
| 2024-11-01 | 222 |
| 2024-10-01 | 329 |
| 2024-09-01 | 279 |
| 2024-08-01 | 283 |
| 2024-07-01 | 315 |
| 2024-06-01 | 300 |
| 2024-05-01 | 292 |
| 2024-04-01 | 324 |
| 2024-03-01 | 292 |
| 2024-02-01 | 299 |
| 2024-01-01 | 346 |
| 2023-12-01 | 283 |
| 2023-11-01 | 324 |
| 2023-10-01 | 337 |
| 2023-09-01 | 292 |
| 2023-08-01 | 312 |
| 2023-07-01 | 299 |
| 2023-06-01 | 302 |
| 2023-05-01 | 379 |
| 2023-04-01 | 335 |
| 2023-03-01 | 349 |
| 2023-02-01 | 326 |
| 2023-01-01 | 391 |
| 2022-12-01 | 393 |
| 2022-11-01 | 412 |
| 2022-10-01 | 382 |
| 2022-09-01 | 325 |
| 2022-08-01 | 380 |
| 2022-07-01 | 353 |
| 2022-06-01 | 401 |
| 2022-05-01 | 452 |
| 2022-04-01 | 417 |
| 2022-03-01 | 444 |
| 2022-02-01 | 400 |
| 2022-01-01 | 418 |
| 2021-12-01 | 416 |
| 2021-11-01 | 467 |
| 2021-10-01 | 422 |
| 2021-09-01 | 398 |
| 2021-08-01 | 420 |
| 2021-07-01 | 394 |
| 2021-06-01 | 447 |
| 2021-05-01 | 448 |
| 2021-04-01 | 397 |
| 2021-03-01 | 452 |
| 2021-02-01 | 385 |
| 2021-01-01 | 384 |
| 2020-12-01 | 436 |
| 2020-11-01 | 434 |
| 2020-10-01 | 475 |
| 2020-09-01 | 527 |
| 2020-08-01 | 433 |
| 2020-07-01 | 443 |
| 2020-06-01 | 508 |
| 2020-05-01 | 463 |
| 2020-04-01 | 483 |
| 2020-03-01 | 541 |
| 2020-02-01 | 410 |
| 2020-01-01 | 433 |
| 2019-12-01 | 457 |
| 2019-11-01 | 425 |
| 2019-10-01 | 461 |
| 2019-09-01 | 357 |
| 2019-08-01 | 238 |
| 2019-07-01 | 284 |
| 2019-06-01 | 280 |
| 2019-05-01 | 281 |
| 2019-04-01 | 289 |
| 2019-03-01 | 209 |
| 2019-02-01 | 210 |
| 2019-01-01 | 215 |
| 2018-12-01 | 318 |
| 2018-11-01 | 283 |
| 2018-10-01 | 373 |
| 2018-09-01 | 303 |
| 2018-08-01 | 259 |
| 2018-07-01 | 340 |
| 2018-06-01 | 267 |
| 2018-05-01 | 287 |
| 2018-04-01 | 325 |
| 2018-03-01 | 235 |
| 2018-02-01 | 243 |
| 2018-01-01 | 292 |
Picture: PNG · SVG · other formats
Large countries naturally send many downloads. To compare them, Flathub downloads and Arch pkgstats submissions are divided by an estimate of the people who use a computer – not of all internet users, because in many countries most people go online with a phone.
PC users ≈ internet users × desktop share of page views. Internet users come from the World Bank (share of the population online × population, newest year, CC BY 4.0); the desktop share is StatCounter's split of page views between desktop, mobile and tablet, averaged over the last twelve months without artefact months.
This is a rough yardstick, not a count: page views are not people, one person may use a phone and a PC, and heavy desktop users weigh more. Countries with fewer than 1 million estimated PC users get no per-million figure. Taiwan has no World Bank figure.