Linux share
2.2%
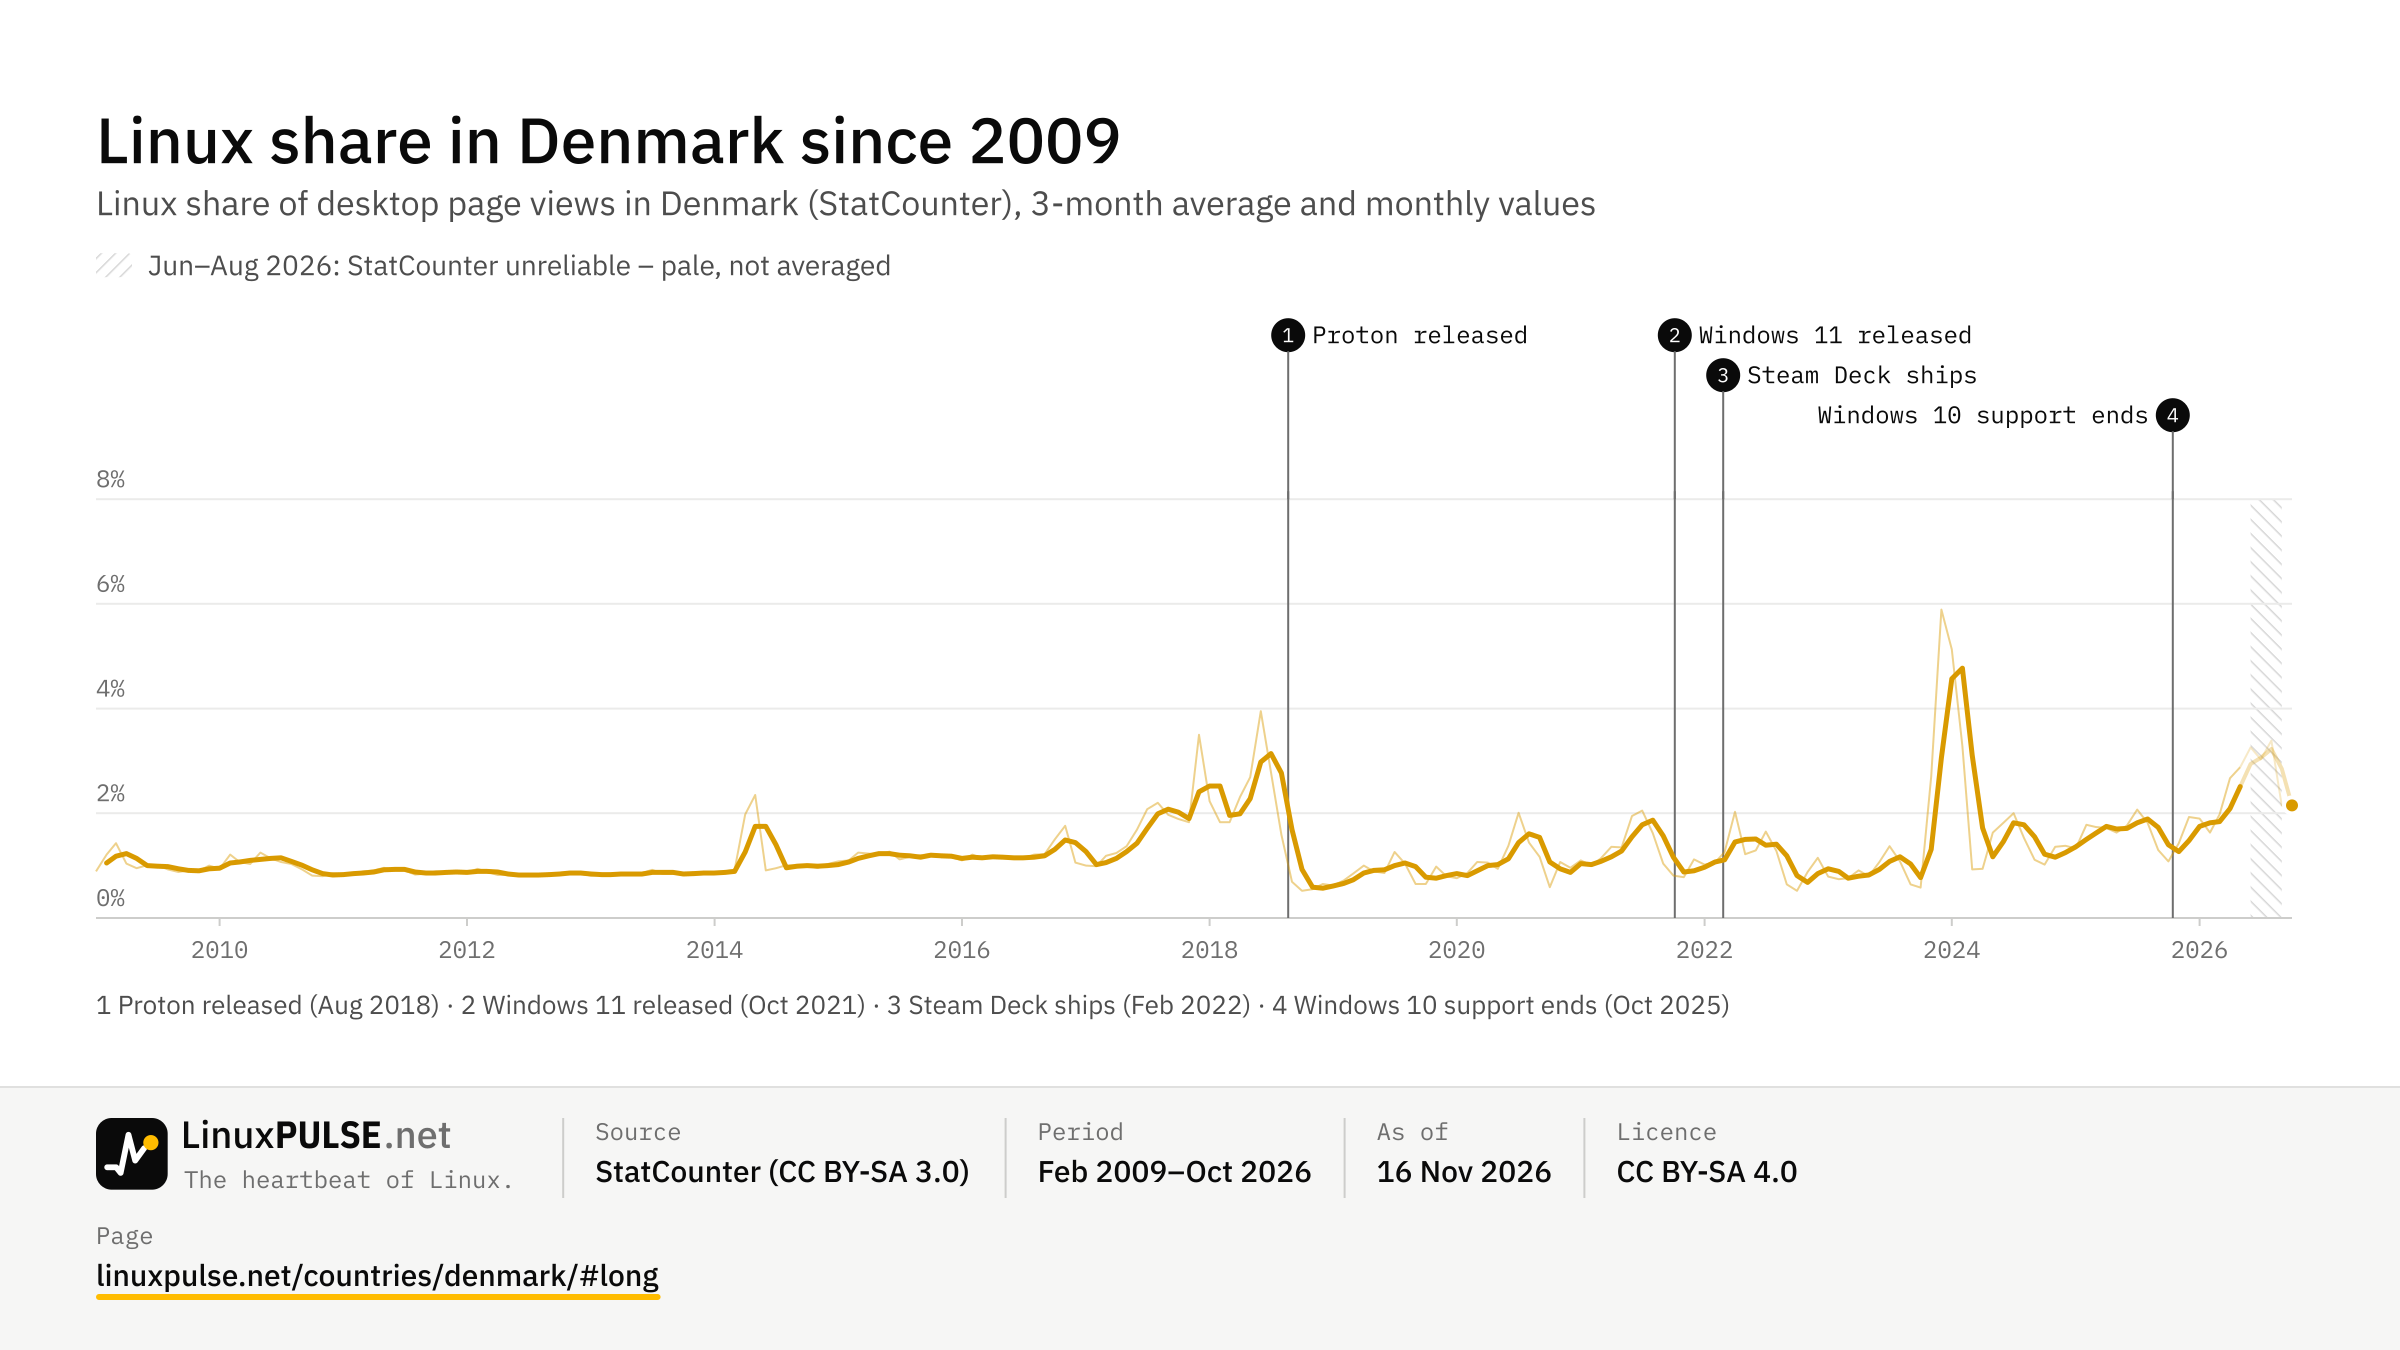
↗ +1.0 pp vs a year agoStatCounter · desktop page views · Sep–Oct 2026Denmark: 2.2 % over the last three months, up from a year ago (+1.0 pp).
Linux share
2.2%
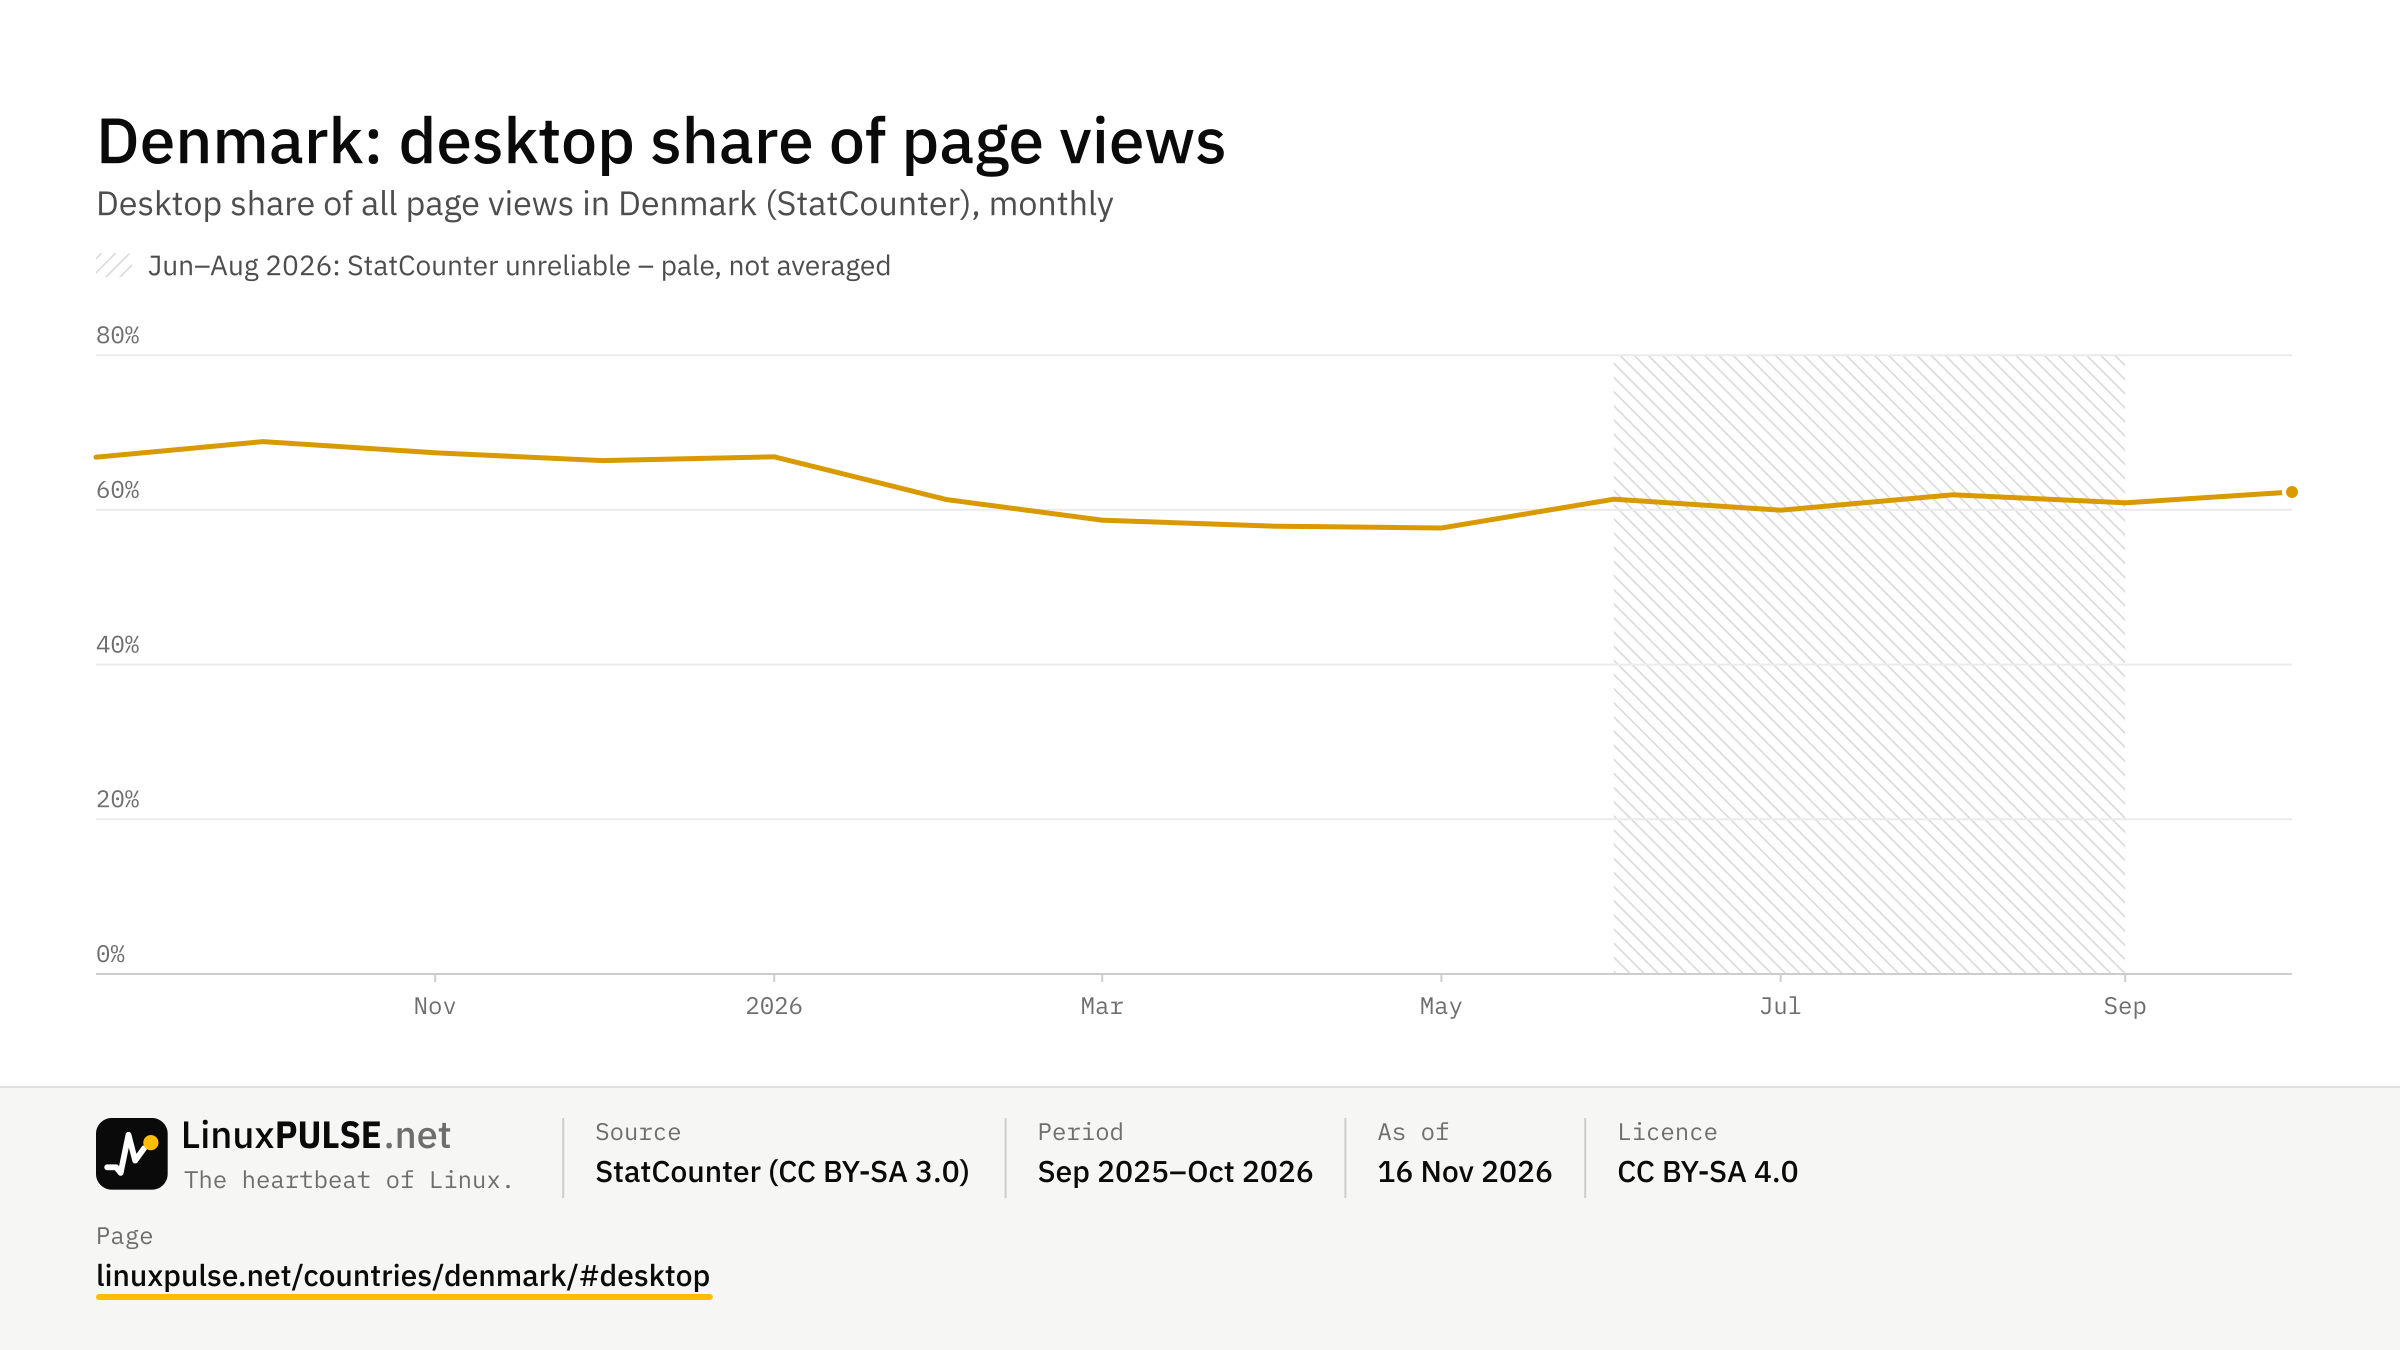
↗ +1.0 pp vs a year agoStatCounter · desktop page views · Sep–Oct 2026Desktop share of page views
63%
StatCounter · desktop vs mobile vs tablet · Sep 2025–May 2026, Sep 2026–Oct 2026PC users (estimate)
3.8M
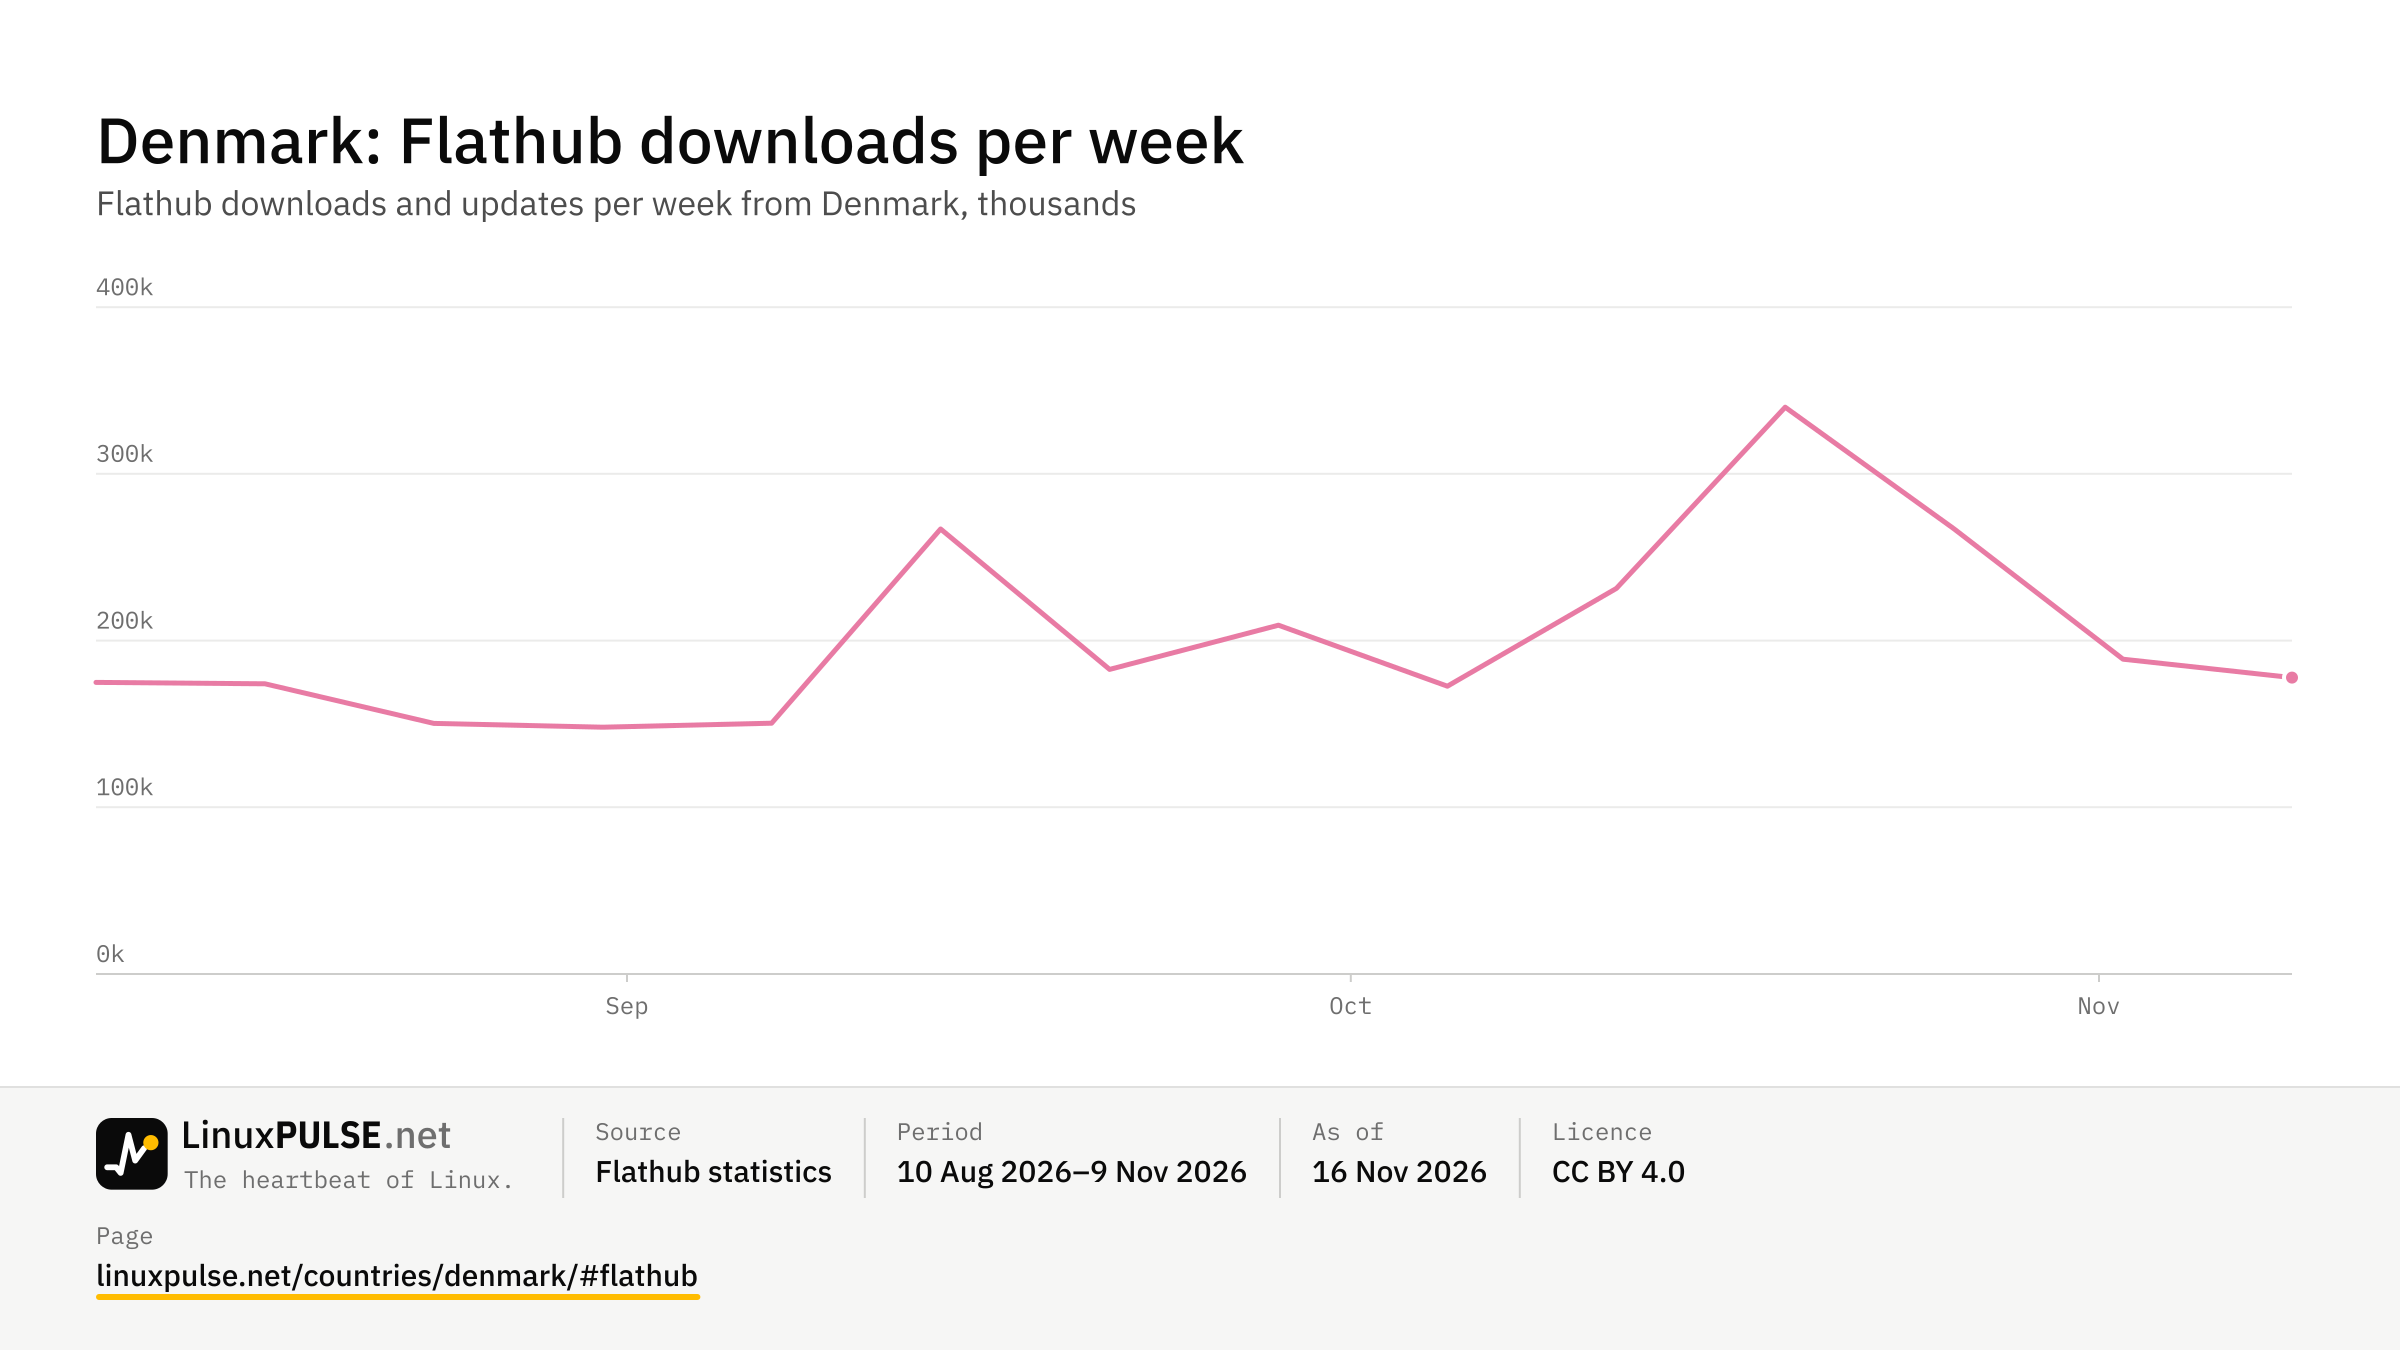
6.0M internet users (2024) · × desktop shareFlathub downloads per week
178K
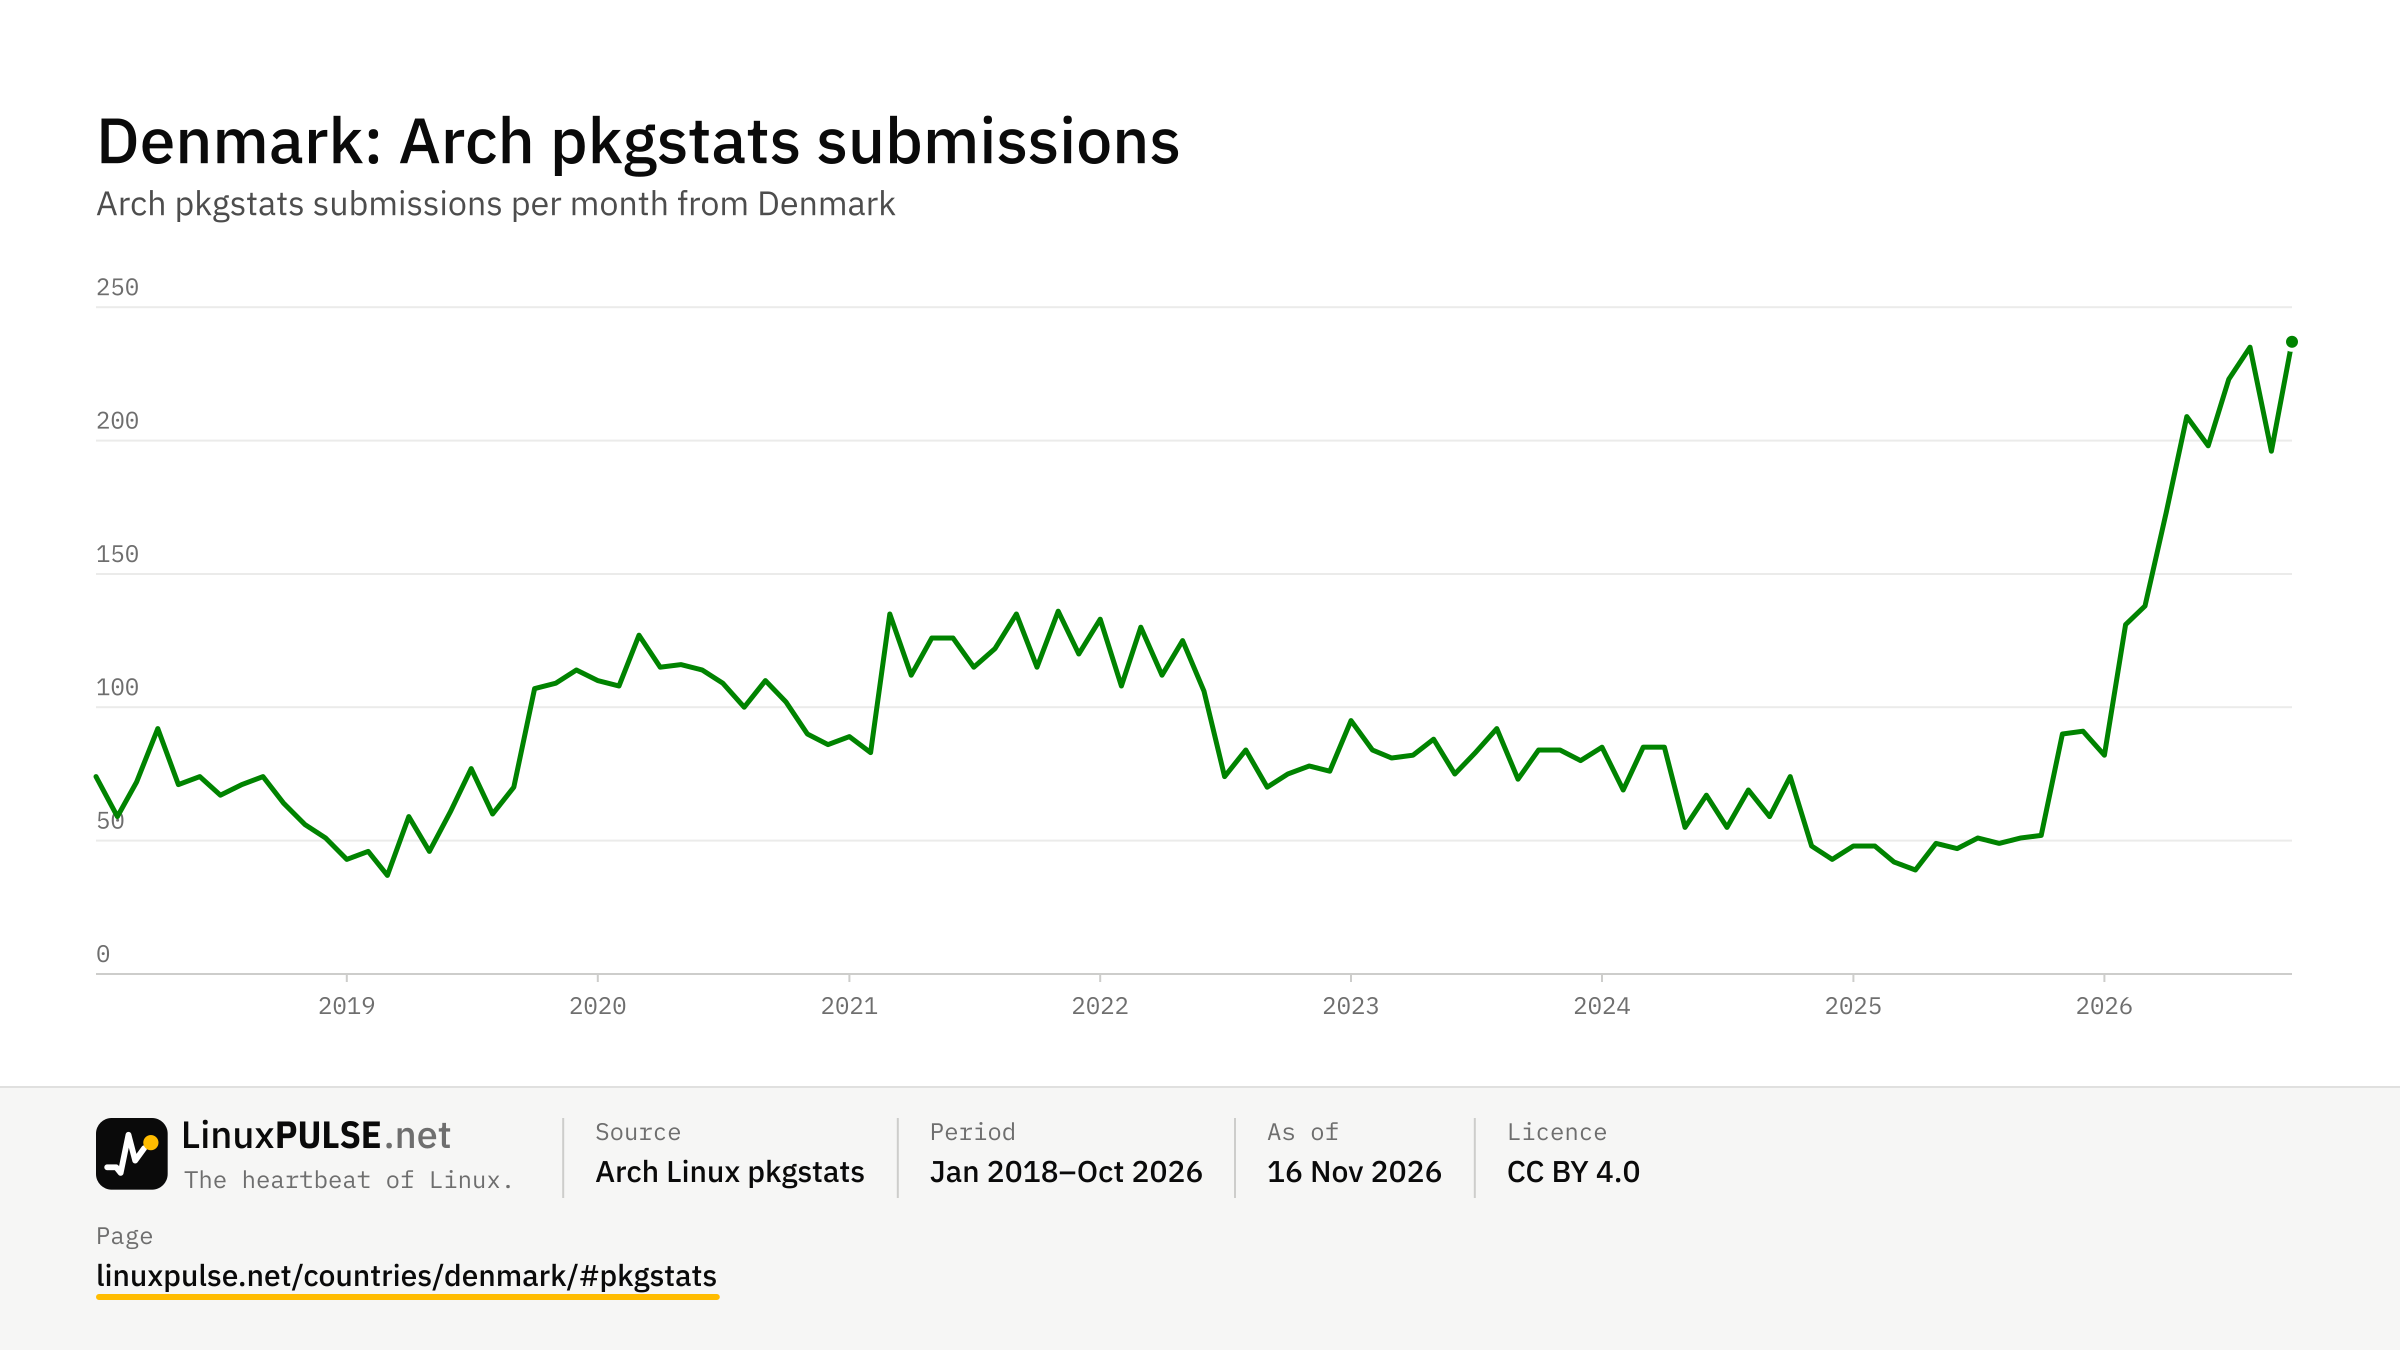
Flathub · week of 9 Nov 2026Arch pkgstats submissions
237
pkgstats · October 2026| Date | Denmark |
|---|---|
| 2026-10-01 | 2.15% |
| 2026-05-01 | 2.51% |
| 2026-04-01 | 2.09% |
| 2026-03-01 | 1.84% |
| 2026-02-01 | 1.82% |
| 2026-01-01 | 1.75% |
| 2025-12-01 | 1.48% |
| 2025-11-01 | 1.27% |
| 2025-10-01 | 1.4% |
| 2025-09-01 | 1.73% |
| 2025-08-01 | 1.89% |
| 2025-07-01 | 1.82% |
| 2025-06-01 | 1.71% |
| 2025-05-01 | 1.7% |
| 2025-04-01 | 1.75% |
| 2025-03-01 | 1.62% |
| 2025-02-01 | 1.5% |
| 2025-01-01 | 1.36% |
| 2024-12-01 | 1.25% |
| 2024-11-01 | 1.16% |
| 2024-10-01 | 1.22% |
| 2024-09-01 | 1.55% |
| 2024-08-01 | 1.78% |
| 2024-07-01 | 1.82% |
| 2024-06-01 | 1.46% |
| 2024-05-01 | 1.17% |
| 2024-04-01 | 1.72% |
| 2024-03-01 | 3.11% |
| 2024-02-01 | 4.77% |
| 2024-01-01 | 4.57% |
| 2023-12-01 | 3.06% |
| 2023-11-01 | 1.31% |
| 2023-10-01 | 0.77% |
| 2023-09-01 | 1.03% |
| 2023-08-01 | 1.17% |
| 2023-07-01 | 1.08% |
| 2023-06-01 | 0.93% |
| 2023-05-01 | 0.82% |
| 2023-04-01 | 0.8% |
| 2023-03-01 | 0.76% |
| 2023-02-01 | 0.89% |
| 2023-01-01 | 0.94% |
| 2022-12-01 | 0.85% |
| 2022-11-01 | 0.68% |
| 2022-10-01 | 0.81% |
| 2022-09-01 | 1.19% |
| 2022-08-01 | 1.41% |
| 2022-07-01 | 1.39% |
| 2022-06-01 | 1.51% |
| 2022-05-01 | 1.5% |
| 2022-04-01 | 1.45% |
| 2022-03-01 | 1.11% |
| 2022-02-01 | 1.07% |
| 2022-01-01 | 0.97% |
| 2021-12-01 | 0.9% |
| 2021-11-01 | 0.88% |
| 2021-10-01 | 1.16% |
| 2021-09-01 | 1.57% |
| 2021-08-01 | 1.87% |
| 2021-07-01 | 1.78% |
| 2021-06-01 | 1.55% |
| 2021-05-01 | 1.28% |
| 2021-04-01 | 1.17% |
| 2021-03-01 | 1.08% |
| 2021-02-01 | 1.02% |
| 2021-01-01 | 1.04% |
| 2020-12-01 | 0.87% |
| 2020-11-01 | 0.94% |
| 2020-10-01 | 1.07% |
| 2020-09-01 | 1.54% |
| 2020-08-01 | 1.61% |
| 2020-07-01 | 1.44% |
| 2020-06-01 | 1.13% |
| 2020-05-01 | 1.02% |
| 2020-04-01 | 1% |
| 2020-03-01 | 0.9% |
| 2020-02-01 | 0.81% |
| 2020-01-01 | 0.85% |
| 2019-12-01 | 0.81% |
| 2019-11-01 | 0.76% |
| 2019-10-01 | 0.78% |
| 2019-09-01 | 0.98% |
| 2019-08-01 | 1.05% |
| 2019-07-01 | 1% |
| 2019-06-01 | 0.92% |
| 2019-05-01 | 0.91% |
| 2019-04-01 | 0.86% |
| 2019-03-01 | 0.73% |
| 2019-02-01 | 0.66% |
| 2019-01-01 | 0.61% |
| 2018-12-01 | 0.57% |
| 2018-11-01 | 0.59% |
| 2018-10-01 | 0.93% |
| 2018-09-01 | 1.69% |
| 2018-08-01 | 2.77% |
| 2018-07-01 | 3.14% |
| 2018-06-01 | 2.98% |
| 2018-05-01 | 2.28% |
| 2018-04-01 | 1.99% |
| 2018-03-01 | 1.96% |
| 2018-02-01 | 2.52% |
| 2018-01-01 | 2.52% |
| 2017-12-01 | 2.41% |
| 2017-11-01 | 1.9% |
| 2017-10-01 | 2.02% |
| 2017-09-01 | 2.08% |
| 2017-08-01 | 1.99% |
| 2017-07-01 | 1.71% |
| 2017-06-01 | 1.43% |
| 2017-05-01 | 1.27% |
| 2017-04-01 | 1.14% |
| 2017-03-01 | 1.06% |
| 2017-02-01 | 1.02% |
| 2017-01-01 | 1.27% |
| 2016-12-01 | 1.44% |
| 2016-11-01 | 1.49% |
| 2016-10-01 | 1.31% |
| 2016-09-01 | 1.19% |
| 2016-08-01 | 1.16% |
| 2016-07-01 | 1.15% |
| 2016-06-01 | 1.15% |
| 2016-05-01 | 1.16% |
| 2016-04-01 | 1.17% |
| 2016-03-01 | 1.15% |
| 2016-02-01 | 1.16% |
| 2016-01-01 | 1.14% |
| 2015-12-01 | 1.18% |
| 2015-11-01 | 1.19% |
| 2015-10-01 | 1.2% |
| 2015-09-01 | 1.16% |
| 2015-08-01 | 1.19% |
| 2015-07-01 | 1.2% |
| 2015-06-01 | 1.23% |
| 2015-05-01 | 1.23% |
| 2015-04-01 | 1.19% |
| 2015-03-01 | 1.14% |
| 2015-02-01 | 1.07% |
| 2015-01-01 | 1.02% |
| 2014-12-01 | 1% |
| 2014-11-01 | 0.99% |
| 2014-10-01 | 1% |
| 2014-09-01 | 0.99% |
| 2014-08-01 | 0.96% |
| 2014-07-01 | 1.4% |
| 2014-06-01 | 1.75% |
| 2014-05-01 | 1.75% |
| 2014-04-01 | 1.26% |
| 2014-03-01 | 0.89% |
| 2014-02-01 | 0.87% |
| 2014-01-01 | 0.86% |
| 2013-12-01 | 0.86% |
| 2013-11-01 | 0.85% |
| 2013-10-01 | 0.84% |
| 2013-09-01 | 0.87% |
| 2013-08-01 | 0.87% |
| 2013-07-01 | 0.87% |
| 2013-06-01 | 0.84% |
| 2013-05-01 | 0.84% |
| 2013-04-01 | 0.84% |
| 2013-03-01 | 0.83% |
| 2013-02-01 | 0.83% |
| 2013-01-01 | 0.84% |
| 2012-12-01 | 0.86% |
| 2012-11-01 | 0.86% |
| 2012-10-01 | 0.84% |
| 2012-09-01 | 0.83% |
| 2012-08-01 | 0.82% |
| 2012-07-01 | 0.82% |
| 2012-06-01 | 0.82% |
| 2012-05-01 | 0.84% |
| 2012-04-01 | 0.88% |
| 2012-03-01 | 0.89% |
| 2012-02-01 | 0.89% |
| 2012-01-01 | 0.87% |
| 2011-12-01 | 0.88% |
| 2011-11-01 | 0.87% |
| 2011-10-01 | 0.86% |
| 2011-09-01 | 0.86% |
| 2011-08-01 | 0.88% |
| 2011-07-01 | 0.93% |
| 2011-06-01 | 0.93% |
| 2011-05-01 | 0.92% |
| 2011-04-01 | 0.88% |
| 2011-03-01 | 0.86% |
| 2011-02-01 | 0.85% |
| 2011-01-01 | 0.83% |
| 2010-12-01 | 0.82% |
| 2010-11-01 | 0.85% |
| 2010-10-01 | 0.92% |
| 2010-09-01 | 1.01% |
| 2010-08-01 | 1.08% |
| 2010-07-01 | 1.15% |
| 2010-06-01 | 1.14% |
| 2010-05-01 | 1.12% |
| 2010-04-01 | 1.1% |
| 2010-03-01 | 1.07% |
| 2010-02-01 | 1.05% |
| 2010-01-01 | 0.95% |
| 2009-12-01 | 0.94% |
| 2009-11-01 | 0.9% |
| 2009-10-01 | 0.91% |
| 2009-09-01 | 0.94% |
| 2009-08-01 | 0.98% |
| 2009-07-01 | 0.99% |
| 2009-06-01 | 1% |
| 2009-05-01 | 1.14% |
| 2009-04-01 | 1.23% |
| 2009-03-01 | 1.18% |
| 2009-02-01 | 1.05% |
Picture: PNG · SVG · other formats
| Date | Desktop |
|---|---|
| 2026-10-01 | 62.32% |
| 2026-09-01 | 60.93% |
| 2026-08-01 | 61.96% |
| 2026-07-01 | 59.95% |
| 2026-06-01 | 61.38% |
| 2026-05-01 | 57.67% |
| 2026-04-01 | 57.9% |
| 2026-03-01 | 58.68% |
| 2026-02-01 | 61.34% |
| 2026-01-01 | 66.87% |
| 2025-12-01 | 66.38% |
| 2025-11-01 | 67.38% |
| 2025-10-01 | 68.82% |
| 2025-09-01 | 66.81% |
Picture: PNG · SVG · other formats
| Date | Flathub downloads |
|---|---|
| 2026-11-09 | 177.8k |
| 2026-11-02 | 188.9k |
| 2026-10-26 | 266.9k |
| 2026-10-19 | 340k |
| 2026-10-12 | 231.3k |
| 2026-10-05 | 172.6k |
| 2026-09-28 | 209.2k |
| 2026-09-21 | 182.7k |
| 2026-09-14 | 266.9k |
| 2026-09-07 | 150.4k |
| 2026-08-31 | 148k |
| 2026-08-24 | 150.3k |
| 2026-08-17 | 174.1k |
| 2026-08-10 | 174.9k |
Picture: PNG · SVG · other formats
| Date | pkgstats submissions |
|---|---|
| 2026-10-01 | 237 |
| 2026-09-01 | 196 |
| 2026-08-01 | 235 |
| 2026-07-01 | 223 |
| 2026-06-01 | 198 |
| 2026-05-01 | 209 |
| 2026-04-01 | 173 |
| 2026-03-01 | 138 |
| 2026-02-01 | 131 |
| 2026-01-01 | 82 |
| 2025-12-01 | 91 |
| 2025-11-01 | 90 |
| 2025-10-01 | 52 |
| 2025-09-01 | 51 |
| 2025-08-01 | 49 |
| 2025-07-01 | 51 |
| 2025-06-01 | 47 |
| 2025-05-01 | 49 |
| 2025-04-01 | 39 |
| 2025-03-01 | 42 |
| 2025-02-01 | 48 |
| 2025-01-01 | 48 |
| 2024-12-01 | 43 |
| 2024-11-01 | 48 |
| 2024-10-01 | 74 |
| 2024-09-01 | 59 |
| 2024-08-01 | 69 |
| 2024-07-01 | 55 |
| 2024-06-01 | 67 |
| 2024-05-01 | 55 |
| 2024-04-01 | 85 |
| 2024-03-01 | 85 |
| 2024-02-01 | 69 |
| 2024-01-01 | 85 |
| 2023-12-01 | 80 |
| 2023-11-01 | 84 |
| 2023-10-01 | 84 |
| 2023-09-01 | 73 |
| 2023-08-01 | 92 |
| 2023-07-01 | 83 |
| 2023-06-01 | 75 |
| 2023-05-01 | 88 |
| 2023-04-01 | 82 |
| 2023-03-01 | 81 |
| 2023-02-01 | 84 |
| 2023-01-01 | 95 |
| 2022-12-01 | 76 |
| 2022-11-01 | 78 |
| 2022-10-01 | 75 |
| 2022-09-01 | 70 |
| 2022-08-01 | 84 |
| 2022-07-01 | 74 |
| 2022-06-01 | 106 |
| 2022-05-01 | 125 |
| 2022-04-01 | 112 |
| 2022-03-01 | 130 |
| 2022-02-01 | 108 |
| 2022-01-01 | 133 |
| 2021-12-01 | 120 |
| 2021-11-01 | 136 |
| 2021-10-01 | 115 |
| 2021-09-01 | 135 |
| 2021-08-01 | 122 |
| 2021-07-01 | 115 |
| 2021-06-01 | 126 |
| 2021-05-01 | 126 |
| 2021-04-01 | 112 |
| 2021-03-01 | 135 |
| 2021-02-01 | 83 |
| 2021-01-01 | 89 |
| 2020-12-01 | 86 |
| 2020-11-01 | 90 |
| 2020-10-01 | 102 |
| 2020-09-01 | 110 |
| 2020-08-01 | 100 |
| 2020-07-01 | 109 |
| 2020-06-01 | 114 |
| 2020-05-01 | 116 |
| 2020-04-01 | 115 |
| 2020-03-01 | 127 |
| 2020-02-01 | 108 |
| 2020-01-01 | 110 |
| 2019-12-01 | 114 |
| 2019-11-01 | 109 |
| 2019-10-01 | 107 |
| 2019-09-01 | 70 |
| 2019-08-01 | 60 |
| 2019-07-01 | 77 |
| 2019-06-01 | 61 |
| 2019-05-01 | 46 |
| 2019-04-01 | 59 |
| 2019-03-01 | 37 |
| 2019-02-01 | 46 |
| 2019-01-01 | 43 |
| 2018-12-01 | 51 |
| 2018-11-01 | 56 |
| 2018-10-01 | 64 |
| 2018-09-01 | 74 |
| 2018-08-01 | 71 |
| 2018-07-01 | 67 |
| 2018-06-01 | 74 |
| 2018-05-01 | 71 |
| 2018-04-01 | 92 |
| 2018-03-01 | 72 |
| 2018-02-01 | 59 |
| 2018-01-01 | 74 |
Picture: PNG · SVG · other formats
Large countries naturally send many downloads. To compare them, Flathub downloads and Arch pkgstats submissions are divided by an estimate of the people who use a computer – not of all internet users, because in many countries most people go online with a phone.
PC users ≈ internet users × desktop share of page views. Internet users come from the World Bank (share of the population online × population, newest year, CC BY 4.0); the desktop share is StatCounter's split of page views between desktop, mobile and tablet, averaged over the last twelve months without artefact months.
This is a rough yardstick, not a count: page views are not people, one person may use a phone and a PC, and heavy desktop users weigh more. Countries with fewer than 1 million estimated PC users get no per-million figure. Taiwan has no World Bank figure.